
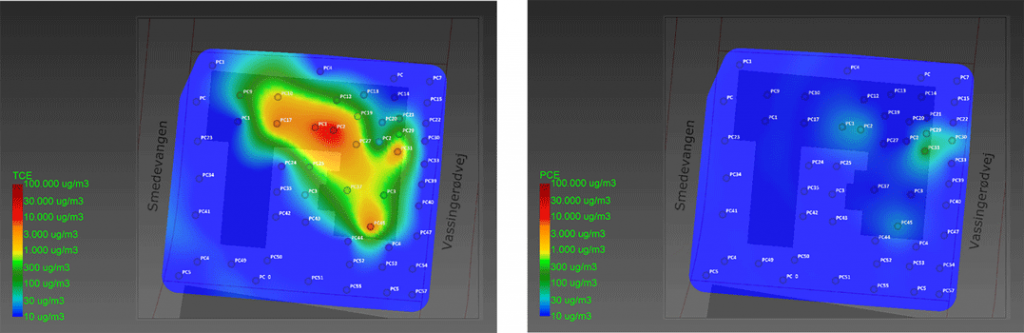
Figure 1. Soil gas results for PCE, TCE, DCE, VC. The results indicate the presence of mainly TCE at this site. The screening also showed the presence of other less expected VOC compounds at one of the sites that could be identified based on the GCMS screening.
The success of soil investigations and remediation designs is highly dependent on a solid and constantly adjusted conceptual site model (CSM). A detailed visualization of the contaminant situation will provide the consultant improved insight into the source, pathways, exposure and remediation alternatives but will also help to recognize and identify the many data gaps and uncertainties.
The CSM is built by collecting and analyzing samples of the site. However, a qualitative characterization of source and plume zone, based on conventional soil samples and monitoring wells, is an intensive and time-consuming task. Since the soil is a very heterogeneous medium and contaminants can have a complex occurrence and distribution, high data densities are required to obtain a sound CSM. With conventional methods this high density cannot be obtained in a cost- nor time-efficient way.
In addition, target depths for monitoring wells are often arbitrarily apprehended for further delineation based on initial results, leading to wrong screen depths and an unreliable CSM. Despite the high accuracy and precision of the analysis at the certified labs where the collected samples end up, a large portion of the accuracy is already lost during the sampling, handling and preserving in the field. Environmental consultants are sometimes blindfolded by the final analytical certificate which gives them a false sense of certainty. To lower the uncertainty and improve the CSM, a higher data density (and more accurate sampling and analysis methods) should be achieved.
In situ screening methods like the Geoprobe® Membrane Interface Probe (MIP) provide a higher data density and perform so called High Resolution Site Characterization (HRSC). In this approach, the scale of measurement matches the scale of the contaminant distribution and soil characteristics. This leads to a greater certainty of the CSM, supporting appropriate risk assessment and faster and more effective site remediation.
To meet the growing need for more accurate and sensitive site investigation of large plumes of (semi) volatiles, the EnISSA-team of MAVA, an environmental consultancy company located in Belgium, developed the EnISSA-MIP.
To increase sensitivity and selectivity of the conventional MIP system, the EnISSA method uses a modified GCMS system which is connected to the MIP system. The advantages of using a GCMS detector are the low, intrinsic detection limits of the detector and the capabilities to measure individual compounds, which brings the lab into the field. Field evaluations demonstrated that the EnISSA MIP is capable of measuring soil profiles for individual compounds with detection limits near 10-20 µg/l.
Since individual components are measured below the soil remediation standards, the applicability of MIP has substantially increased. Both source and plume delineation is possible. The component-specific soil profiles allow reliable onsite decisions and a dynamic sampling strategy. The on-site information on pollutant cocktails is directly correlated to the remediation standards and are an added value to the data obtained by the sum-detectors used in conventional MIP.
This makes it possible to delineate the entire source, and especially the plume, giving a well-defined image of the contaminated area and reducing both sampling costs and time.
Since 2010 EnISSA has been deployed at more than 150 project locations for different clients throughout Europe (Belgium, The Netherlands, Denmark, Sweden, Germany, France, Spain, Switzerland). Those projects showed the benefits of EnISSA in very different contaminant situations going from classical cVOCs and BTEX up to MTBE or MIBK, hexane, chlorobenzene, naphthalene, and also demonstrated how EnISSA is capable of enhancing the conceptual site model (CSM) resulting in accurate decision making.
Recently a Danish consultant invited an EnISSA field crew to provide high resolution data at three neighboring industrial sites located in the Copenhagen area. Due to historical activities, the sites were suspected to be contaminated with chlorinated solvents and BTEX. A fast and cost-effective sampling strategy was requested to investigate and delineate the presence of those contaminants.
The overall geology in the area is about 40-50 meters of prequaternary sediments, mainly meltwater sediments underlain by limestone. Local geology in general consists of 0-3 m fill material underlain by clay till to around 10 m-bgl. Below the meltwater, sediments consist of sand and gravel with embedded layers of more silty materials. At the sites, the groundwater level is about 8 m-bgl.
Because little was known about the possible sources of contaminants, at the start of the campaign EnISSA’s field GCMS method was used to analyse >400 tedlar bags with soil gas samples taken with soil gas probe and vacuum box at 1.0 m-bgl to screen for hot spots/source zones. The high horizontal resolution data were imported and modelled to clearly visualize the situation. Results are shown in Figure 1.
Based on the horizontal screening, an EnISSA-MiHPT grid has been established, and the contaminant distribution and soil hydrogeology were characterized. Although the 6620DT rig was used to perform the MIP drillings, MIP locations were limited by accessibility at the active warehouse.
The Hydraulic Profiling Tool (HPT), which was used in the combined MIP-HPT probe (MiHPT), showed to be very interesting in this typical meltwater sediments. Formation with low permeability (max HPT pressure) were alternated with high permeability materials (HPT pressure close to zero) as seen in Figure 2. This important information is less clear from the EC logs.
The EnISSA GCMS MIP results indicate little degradation at this location. The contamination is mainly TCE. A cross section of the TCE results is shown in Figure 3. A typical EnISSA-MIP profile from another project, demonstrating the added value of the compound specific results, is shown in Figure 4. PCE is degraded to TCE and cis-1,2-DCE but further degradation is observed and no vinyl chloride is detected.
These results indicate the differences in occurrence of the breakdown products with depth resulting in more insight in degradation and remediation potential.
In total, at the 3 sites, 37 EnISSA-MiHPT’s were performed to deliver a complete characterization of the contamination and soil hydrogeology. The data was loaded in the EnISSA visualisation and modelling software application to clearly summarize this huge dataset (3D images for every individual contaminant).
Contact Us
1835 Wall Street
Salina, Kansas 67401
Phone: (785) 825-1842
Photo Gallery
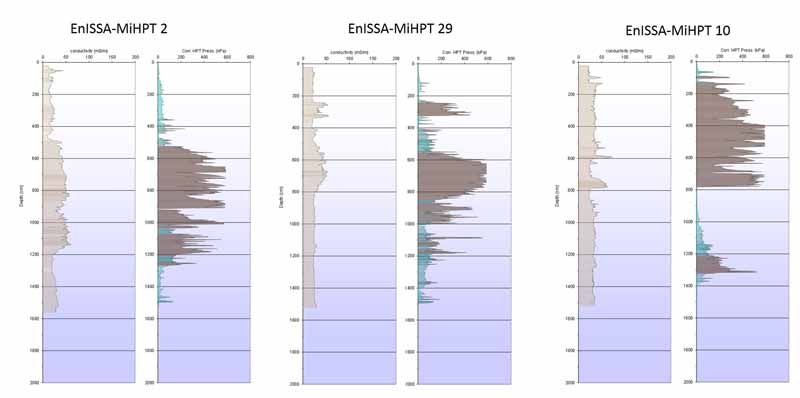
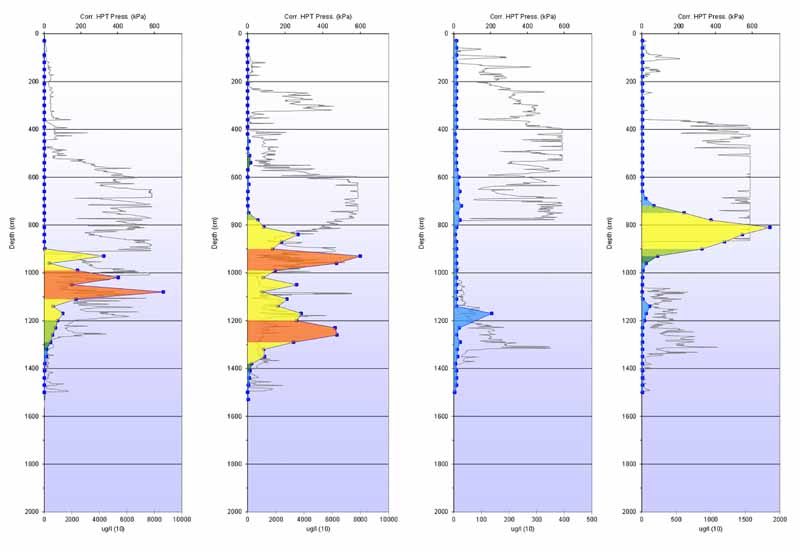
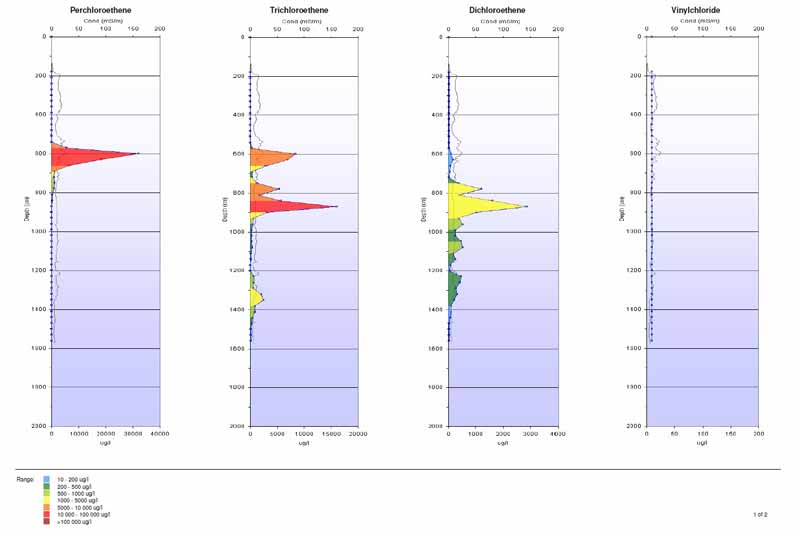
Figure 1. Soil gas results for PCE, TCE, DCE, VC. The results indicate the presence of mainly TCE at this site. The screening also showed the presence of other less expected VOC compounds at one of the sites that could be identified based on the GCMS screening.
Figure 2. EC-HPT Cross Section.
Figure 3. Cross Section TCE results.
Figure 4. A typical EnISSA-MIP profile from another project, demonstrating the added value of the compound specific results.
Related Videos
ID: 6608
ID: 6082
ID: 5344
ID: 1975
ID: 1892
ID: 1995
ID: 1979
ID: 1977