
Log Relative Distribution of NAPL Level Fuels and Oils with Depth in Soil
The OIP (Optical Image Profiler) is a direct push fluorescence detector tool used for the delineation of non-aqueous phase liquid (NAPL) hydrocarbon fuels and oils. The OIP-UV probe is designed with UV and visible light sources which are directed out a sapphire window. As the optical image probe is advanced into the subsurface, the UV light source will induce fluorescence of the fuel polycyclic aromatic hydrocarbons (PAHs). This fluorescence is captured by an onboard camera which operates at 30 images per second. Images are saved throughout the advancement of the log and still photos are taken using UV and visible light sources each rod addition as well as at operator chosen depths. Soil fluorescence images (20 per ft) are saved throughout the log and can be reviewed in Direct Image® Viewer after the log is complete. The OIP-G is available for heavier fuel or oil products.
= Tool String Diagram (TSD)
OIP Overview
What is Geoprobe® Direct Image® OIP?
- The OIP system produces a detailed log of induced fuel fluorescence with depth.
- A downhole camera operates at 30 frames per second (fps) to capture fuel fluorescence.
- The acquisition software analyzes each image for typical fuel fluorescence color.
- The results are the percent of the image area (up to 100%) that displays fuel fluorescence.
- Fluorescence images are saved in the log every 0.05ft (15mm) for review at a later time.
- OIP is simple to learn and operate.
- OIP log Interpretation is intuitive, made simple by the saved images to compare to the log.
- The OIP-UV probe contains both 275nm UV and visible LEDs. This tool is designed for common fuels and oils such as gasoline, diesel, jet fuel, motor, hydraulic and cutting oil.
- The OIP-G probe contains both 520nm LD and infrared LEDs. This tool is designed for heavier fuels and oils such as creosote, coal tars, crude oil and heavy bunker fuels.
- Able to automatically and manually capture visible soil images with the OIP-UV.
- Collect OIP fluorescence, EC, and HPT data with an optional probe configuration that includes CPT data.
Video:
Optical Image Profiler (OIP) Overview
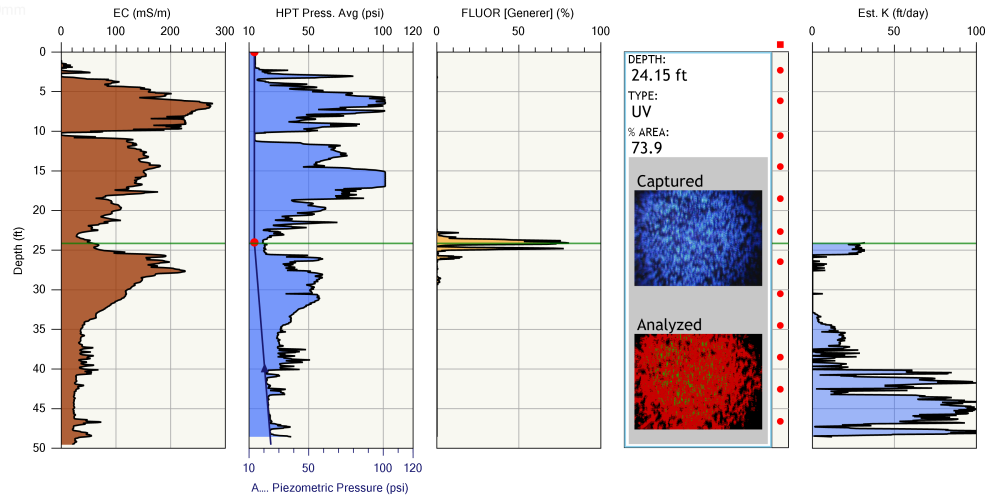
Typical OIP-UV Log:
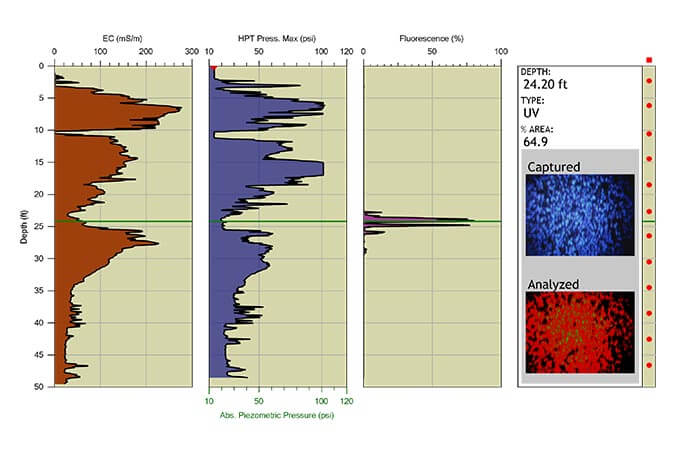
Graphs (left to right) Soil Electrical Conductivity, HPT Pressure with Absolute Piezometric Pressure and Static Water Level, Fuel Fluorescence, depth specific Fluorescence Image, Estimated Hydraulic Conductivity (K)
OIP is a logging tool that uses real time analysis of fluorescence images to map position and relative concentration of non-aqueous phase hydrocarbons. Images are saved (20 per foot) in the log for later review and confirmation.
Principles of Operation
The OIP-UV is a tool for mapping light non-aqueous phase liquids (LNAPL), residual LNAPL, and light oils. The OIP-UV system utilizes a 275nm ultraviolet (UV) light emitting diode (LED) to produce fluorescence from the polycyclic aromatic hydrocarbons (PAHs) contained in fuels and light oils. The UV light is directed out a sapphire window in the side of the probe (Figure 1) onto the soil. When LNAPL level fuels are present, the PAH molecules will absorb the UV light energy and shortly afterwards emit a light photon (fluorophore) which is the resultant fluorescence. Directly behind the sapphire window, the onboard camera captures images of the soil and any fluorescence produced by hydrocarbon contaminants present. The acquisition software analyzes each pixel of the images taken for the presence of color typical of fuel fluorescence. If there is no fuel present in the formation, or it is not in high enough concentration, then the returned camera image will appear black or dark under the UV light source. The OIP acquisition software logs percent area fluorescence with depth. The OIP-UV probe contains a visible as well as UV LEDs. The visible images are useful for determination of soil color, texture and occasionally confirming the presence of fuel or oil LNAPL globules.
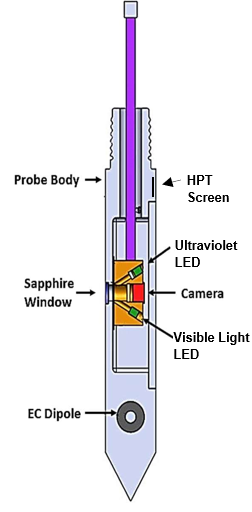
Figure 1:
OIP Probe Schematic
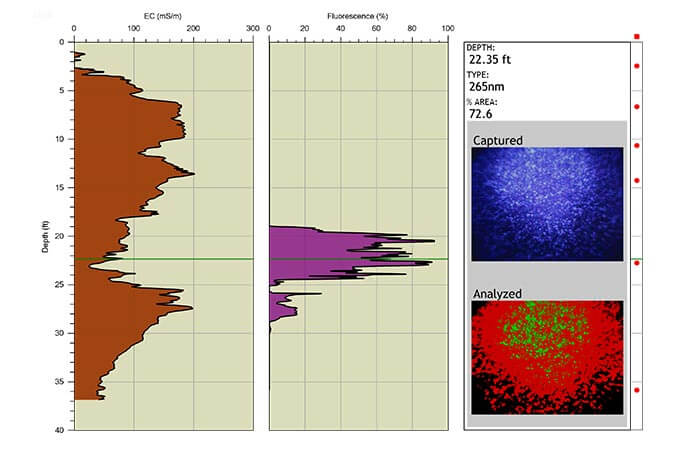
The camera within the OIP probe operates at 30 frames per second with the log % area fluorescence (%AF) value being an average of all the images taken over a 0.05ft (1.5cm) interval. As the log is reviewed in Direct Image® Viewer, the user can click on the log and a green line will show up across the log which corresponds to a specific depth. The image saved from that depth will display if the OIP Image Display graph is shown. In Figure 2 the depth of the displayed saved image is 24.20ft, it is a UV image with the actual image being displayed in the "captured" image section. The "analyzed" image indicates which pixels within the image display fluorescent color consistent with the color expected for fuel fluorescence. There are two colors that may show up in the analyzed image: red which corresponds to the darker blue colors of the image and green which corresponds to areas of high brightness either due to very low color saturation or high brightness of the image. This is used in an attempt to isolate out possible false mineral fluorescence. The overlaid image takes both the captured image and analyzed image and overlays them so the operator can identify areas that are being counted as fluorescence. Images are saved as the probe is moving for every 0.05ft. The red dots on the right side column of the image display graph are depths that "Still Images" were taken. This will contain both UV and visible light still images on the OIP-UV probe. The OIP-G fluorescence detector probe takes images using a 520nm green laser diode and an infrared LED.
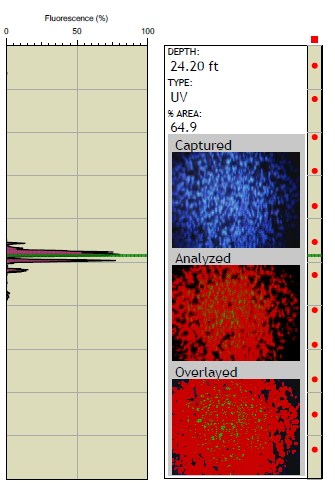
Figure 2:
OIP Fluorescence Log with Depth Specific Image and Software Image Analysis
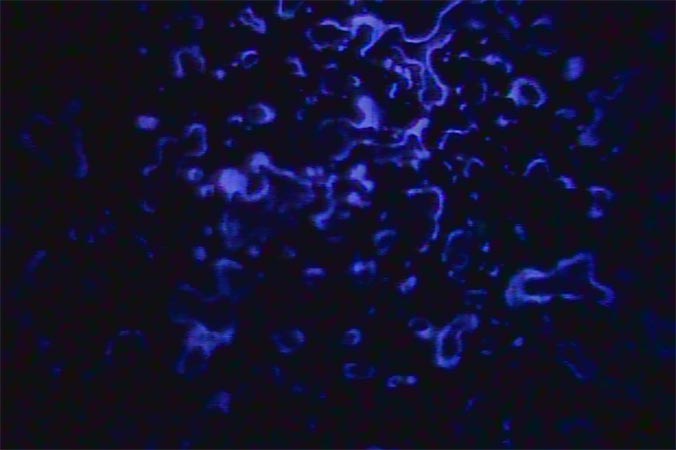
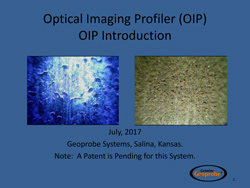
The OIP system software saves 20 images per foot (65 per meter), an example portion of the saved images that an OIP-UV log would contain is shown in Figure 3. These images are saved as the OIP-UV probe is advanced into the subsurface with a typical OIP log containing hundreds of images and being a few hundred mb in size depending upon terminal log depth and amount of color present in the images. Where there is no NAPL or residual NAPL present the images are black, where hydrocarbon NAPL is present blue fluorescence is seen within the images.
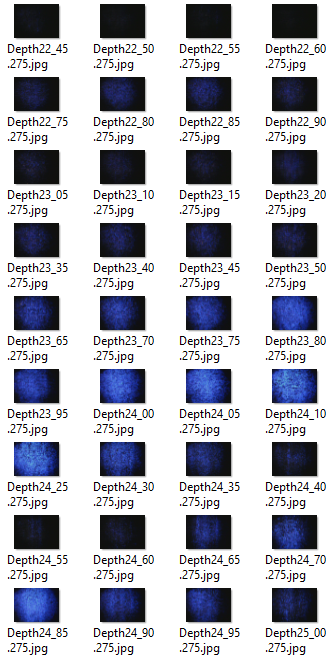
Figure 3:
Saved images from an OIP-UV log
Example Logs
The OIHPT-UV Log in Figure 4 displays the following graphs (left to right) electrical conductivity, HPT injection pressure, OIP % image area fluorescence, depth specific saved UV images, depth specific saved visible images, and estimate of hydraulic conductivity (K). The red dots to the right of the saved images indicate locations of still UV and visible images saved in the file.
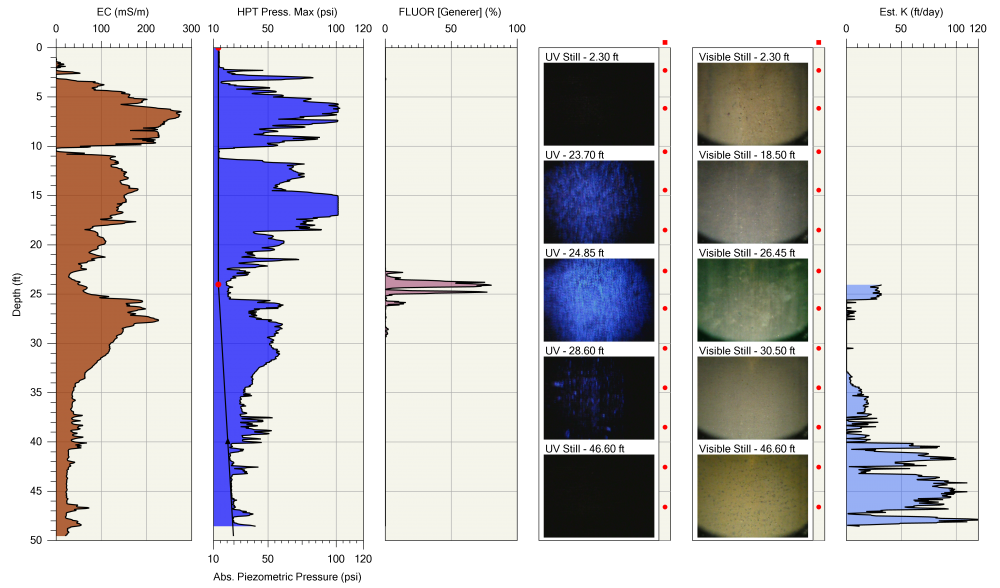
Figure 4:
OIP-UV Log
The OIP-G log in Figure 5 was performed on a creosote site in the northeast US. The OIP-G probe, which induces fluorescence utilizing a 520nm green laser diode (LD), returns a fluorescence image in the orange-red color range as depicted in the saved images from 10-20ft in the right column of the log. The red dots are the saved still images which are taken with the 520nm green LD and an infrared (IR) LED.
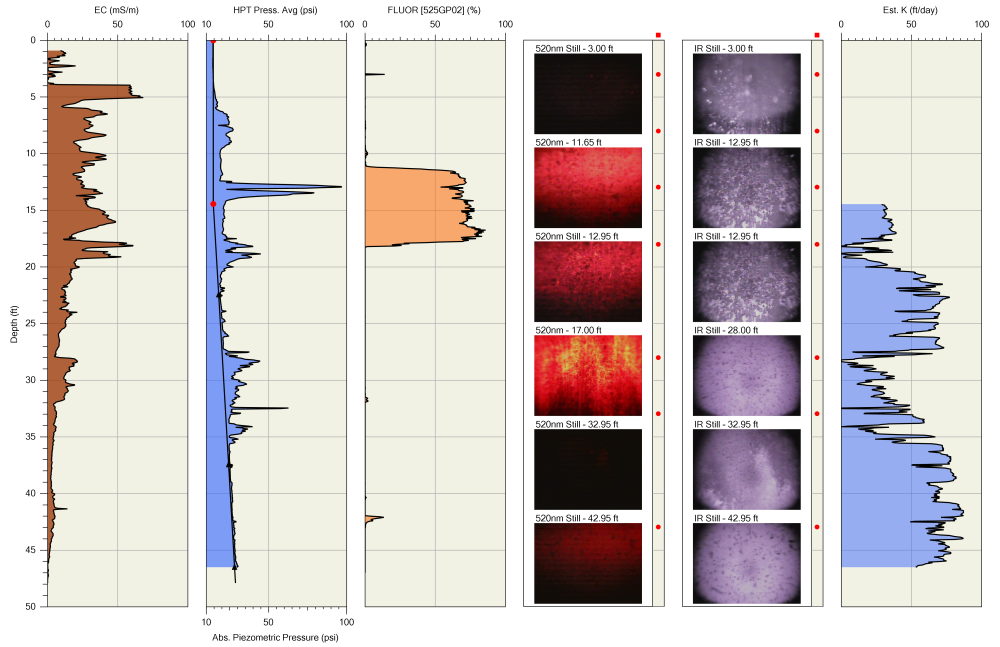
Figure 5:
OIP-G Log
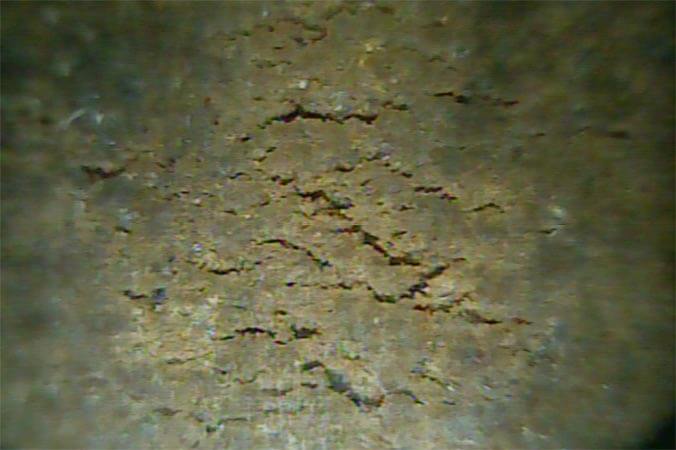
When the probe is stopped to add rods, still images will be captured with both available light sources in the OIP probe. Still images can be captured at any time an operator desires by stopping the probe advancement and selecting a button in the software. The process only takes a few seconds to complete and probe advancement can resume. These still images provide greater image clarity and an opportunity to look at the soil and fuel under visible light. Visible images provide the investigator an opportunity to observe soil color and texture in-situ. Occasionally when hydrocarbon NAPL is present in a saturated sand formation NAPL globules are evident in both the UV and visible images (Figure 6).
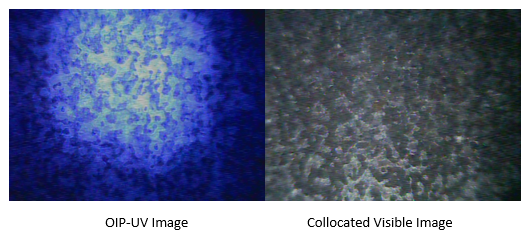
Figure 6:
Collocated UV and Visible Still Images
DI Viewer is a free program downloadable from the link below which allows the user to display any of the Direct Image® log types (MIP, OIP, HPT, EC). With this program the user can display the raw data .zip files of each saved graph of an individual log in single log view or compare them to other logs using the overlay and cross sectional view functions. Log specific QA data is also accessible with this software which also allows one to print or export the logs data for 3D modeling or into .jpg or .png files.
Frequently Asked Questions
- Can we differentiate between fuel types with OIP?
The OIP software does not automatically provide any distinct product designation based upon the fluorescence image returned from the oil. Each fuel or oil type may give a slightly different coloration of the respondent fluorescent image. Assuming that the coloration of the QA diesel and motor oil images are consistent throughout the project, if the coloration of the fuel fluorescence has changes in the borehole or between logs then the different is likely due to either different levels of weathering of the same fuel/oil product or there are two separate fuel/oils present.
- Can we determine concentration from the OIP fluorescence response?
No concentration can not be determined. OIP Fluorescence only occurs when fuel or oil NAPL or residual NAPL is present. The higher the % fluorescence response the greater the distribution of fuel NAPL.
- What does the OIP Fluor (General) % mean?
The standard OIP-UV fluorescence graph is the result of a software filter that analyzes all of the pixels within an OIP-UV image that is displaying coloration (Hue, Saturation and Value) that is consistent with common fuels and oils. The resulting fluorescence is the % of the pixels within the image that are displaying this general fluorescence coloration (% of the image area). This is related more to distribution of fuel NAPL – the higher the % Fluorescence and the thicker the zone of fluorescence the more product NAPL that is present.
- Are there any known false positive fluorescence?
Yes, there can be false positive fluorescence such as calcium carbonates found in calcite mineral deposits or seashells. These calcium carbonates can be a bigger issue with false positives on the 520nm Green light source. Paper and clothing can also provide false positive fluorescence readings but may be less likely to occur in a natural setting. To help aid in determining if the fluorescence is real or a false positive, we strongly encourage numerous visible images being captured during advancement through fluorescing zones to compare the UV or G fluorescence image to the grains in the visible/IR image.
- Why is an Infrared source used as the secondary light source on the 520nm green probe?
The OIP-G probe has a 520nm green light source, which as the name states is in the visible light range displayed as a green light. Because of this we are not able to use a visible light as the secondary source. We would see a significant amount of residual green light in the visible image. Also because of this in our green probe we must add a filter over the camera to block all the light wavelengths that will cause background coloration from reflected source light from the soil. With that filter in place over the camera we lose all natural color of the soil so using an infrared source results in a black and white color image. We do not worry about the color of the soil but can still get an indication of the texture of the soil which can still aid in interpretation of the log fluorescence or if false positives are present.
- Can I just use the visible light as the main for the log?
Absolutely. If there is great interest in soil color and texture, or work trying to amp a specific coloration within the geologic formation such as dark peat or in inject carbon zone these can stand out under the visible light source. The probe can be advanced using the visible light as the primary light source.
- Is it possible to have fuel NAPL but not get any or much fluorescence?
BTEX components fluoresce in the UV range and jet fuel/kerosene fluorescence can be challenging with the 275nm UV light source. If the fuel that is gasoline with the primary contaminants being BTEX or jet fuel it is possible that little fluoresce will be observed in the UV logs and images while a sheen could be observed in an adjacent soil or groundwater sample.
- Will OIP-UV or G fluoresce DNAPL solvents?
No chlorinated DNAPL solvents will not fluoresce on their own without help from something else. Many chlorinated solvents like Trichloroethylene and Trichloroethane have been used as degreaser in industrial manufacturers. In this case there is a likelihood that the comingled oils and greases within the DNAPL will fluorescence under the OIP-UV excitation. We recommend a sample being collected and tested prior to mobilization for this purpose. Also, MIP can be used the track the chlorinated solvent plume from DNAPL to sub ppm levels.
Features & Options
OIP-UV Probe
What is Geoprobe® Direct Image® OIP?
- The OIP system produces a detailed log of induced fuel fluorescence with depth.
- A downhole camera operates at 30 frames per second (fps) to capture fuel fluorescence.
- The acquisition software analyzes each image for typical fuel fluorescence color.
- The results are the percent of the image area (up to 100%) that displays fuel fluorescence.
- Fluorescence images are saved in the log every 0.05ft (15mm) for review at a later time.
- OIP is simple to learn and operate.
- OIP log Interpretation is intuitive, made simple by the saved images to compare to the log.
- The OIP-UV probe contains both 275nm UV and visible LEDs. This tool is designed for common fuels and oils such as gasoline, diesel, jet fuel, motor, hydraulic and cutting oil.
- The OIP-G probe contains both 520nm LD and infrared LEDs. This tool is designed for heavier fuels and oils such as creosote, coal tars, crude oil and heavy bunker fuels.
- Able to automatically and manually capture visible soil images with the OIP-UV.
- Collect OIP fluorescence, EC, and HPT data with an optional probe configuration that includes CPT data.
Video: Optical Image Profiler (OIP) Overview
Typical OIP-UV Log:
Graphs (left to right) Soil Electrical Conductivity, HPT Pressure with Absolute Piezometric Pressure and Static Water Level, Fuel Fluorescence, depth specific Fluorescence Image, Estimated Hydraulic Conductivity (K)
OIP is a logging tool that uses real time analysis of fluorescence images to map position and relative concentration of non-aqueous phase hydrocarbons. Images are saved (20 per foot) in the log for later review and confirmation.
The OIP-UV is a tool for mapping light non-aqueous phase liquids (LNAPL), residual LNAPL, and light oils. The OIP-UV system utilizes a 275nm ultraviolet (UV) light emitting diode (LED) to produce fluorescence from the polycyclic aromatic hydrocarbons (PAHs) contained in fuels and light oils. The UV light is directed out a sapphire window in the side of the probe (Figure 1) onto the soil. When LNAPL level fuels are present, the PAH molecules will absorb the UV light energy and shortly afterwards emit a light photon (fluorophore) which is the resultant fluorescence. Directly behind the sapphire window, the onboard camera captures images of the soil and any fluorescence produced by hydrocarbon contaminants present. The acquisition software analyzes each pixel of the images taken for the presence of color typical of fuel fluorescence. If there is no fuel present in the formation, or it is not in high enough concentration, then the returned camera image will appear black or dark under the UV light source. The OIP acquisition software logs percent area fluorescence with depth. The OIP-UV probe contains a visible as well as UV LEDs. The visible images are useful for determination of soil color, texture and occasionally confirming the presence of fuel or oil LNAPL globules.
Figure 1:
OIP Probe Schematic
The camera within the OIP probe operates at 30 frames per second with the log % area fluorescence (%AF) value being an average of all the images taken over a 0.05ft (1.5cm) interval. As the log is reviewed in Direct Image® Viewer, the user can click on the log and a green line will show up across the log which corresponds to a specific depth. The image saved from that depth will display if the OIP Image Display graph is shown. In Figure 2 the depth of the displayed saved image is 24.20ft, it is a UV image with the actual image being displayed in the "captured" image section. The "analyzed" image indicates which pixels within the image display fluorescent color consistent with the color expected for fuel fluorescence. There are two colors that may show up in the analyzed image: red which corresponds to the darker blue colors of the image and green which corresponds to areas of high brightness either due to very low color saturation or high brightness of the image. This is used in an attempt to isolate out possible false mineral fluorescence. The overlaid image takes both the captured image and analyzed image and overlays them so the operator can identify areas that are being counted as fluorescence. Images are saved as the probe is moving for every 0.05ft. The red dots on the right side column of the image display graph are depths that "Still Images" were taken. This will contain both UV and visible light still images on the OIP-UV probe. The OIP-G fluorescence detector probe takes images using a 520nm green laser diode and an infrared LED.
Figure 2:
OIP Fluorescence Log with Depth Specific Image and Software Image Analysis
The OIP system software saves 20 images per foot (65 per meter), an example portion of the saved images that an OIP-UV log would contain is shown in Figure 3. These images are saved as the OIP-UV probe is advanced into the subsurface with a typical OIP log containing hundreds of images and being a few hundred mb in size depending upon terminal log depth and amount of color present in the images. Where there is no NAPL or residual NAPL present the images are black, where hydrocarbon NAPL is present blue fluorescence is seen within the images.
Figure 3:
Saved images from an OIP-UV log
The OIHPT-UV Log in Figure 4 displays the following graphs (left to right) electrical conductivity, HPT injection pressure, OIP % image area fluorescence, depth specific saved UV images, depth specific saved visible images, and estimate of hydraulic conductivity (K). The red dots to the right of the saved images indicate locations of still UV and visible images saved in the file.
Figure 4:
OIP-UV Log
The OIP-G log in Figure 5 was performed on a creosote site in the northeast US. The OIP-G probe, which induces fluorescence utilizing a 520nm green laser diode (LD), returns a fluorescence image in the orange-red color range as depicted in the saved images from 10-20ft in the right column of the log. The red dots are the saved still images which are taken with the 520nm green LD and an infrared (IR) LED.
Figure 5:
OIP-G Log
When the probe is stopped to add rods, still images will be captured with both available light sources in the OIP probe. Still images can be captured at any time an operator desires by stopping the probe advancement and selecting a button in the software. The process only takes a few seconds to complete and probe advancement can resume. These still images provide greater image clarity and an opportunity to look at the soil and fuel under visible light. Visible images provide the investigator an opportunity to observe soil color and texture in-situ. Occasionally when hydrocarbon NAPL is present in a saturated sand formation NAPL globules are evident in both the UV and visible images (Figure 6).
Figure 6:
Collocated UV and Visible Still Images
DI Viewer is a free program downloadable from the link below which allows the user to display any of the Direct Image® log types (MIP, OIP, HPT, EC). With this program the user can display the raw data .zip files of each saved graph of an individual log in single log view or compare them to other logs using the overlay and cross sectional view functions. Log specific QA data is also accessible with this software which also allows one to print or export the logs data for 3D modeling or into .jpg or .png files.
- Can we differentiate between fuel types with OIP?
The OIP software does not automatically provide any distinct product designation based upon the fluorescence image returned from the oil. Each fuel or oil type may give a slightly different coloration of the respondent fluorescent image. Assuming that the coloration of the QA diesel and motor oil images are consistent throughout the project, if the coloration of the fuel fluorescence has changes in the borehole or between logs then the different is likely due to either different levels of weathering of the same fuel/oil product or there are two separate fuel/oils present.
- Can we determine concentration from the OIP fluorescence response?
No concentration can not be determined. OIP Fluorescence only occurs when fuel or oil NAPL or residual NAPL is present. The higher the % fluorescence response the greater the distribution of fuel NAPL.
- What does the OIP Fluor (General) % mean?
The standard OIP-UV fluorescence graph is the result of a software filter that analyzes all of the pixels within an OIP-UV image that is displaying coloration (Hue, Saturation and Value) that is consistent with common fuels and oils. The resulting fluorescence is the % of the pixels within the image that are displaying this general fluorescence coloration (% of the image area). This is related more to distribution of fuel NAPL – the higher the % Fluorescence and the thicker the zone of fluorescence the more product NAPL that is present.
- Are there any known false positive fluorescence?
Yes, there can be false positive fluorescence such as calcium carbonates found in calcite mineral deposits or seashells. These calcium carbonates can be a bigger issue with false positives on the 520nm Green light source. Paper and clothing can also provide false positive fluorescence readings but may be less likely to occur in a natural setting. To help aid in determining if the fluorescence is real or a false positive, we strongly encourage numerous visible images being captured during advancement through fluorescing zones to compare the UV or G fluorescence image to the grains in the visible/IR image.
- Why is an Infrared source used as the secondary light source on the 520nm green probe?
The OIP-G probe has a 520nm green light source, which as the name states is in the visible light range displayed as a green light. Because of this we are not able to use a visible light as the secondary source. We would see a significant amount of residual green light in the visible image. Also because of this in our green probe we must add a filter over the camera to block all the light wavelengths that will cause background coloration from reflected source light from the soil. With that filter in place over the camera we lose all natural color of the soil so using an infrared source results in a black and white color image. We do not worry about the color of the soil but can still get an indication of the texture of the soil which can still aid in interpretation of the log fluorescence or if false positives are present.
- Can I just use the visible light as the main for the log?
Absolutely. If there is great interest in soil color and texture, or work trying to amp a specific coloration within the geologic formation such as dark peat or in inject carbon zone these can stand out under the visible light source. The probe can be advanced using the visible light as the primary light source.
- Is it possible to have fuel NAPL but not get any or much fluorescence?
BTEX components fluoresce in the UV range and jet fuel/kerosene fluorescence can be challenging with the 275nm UV light source. If the fuel that is gasoline with the primary contaminants being BTEX or jet fuel it is possible that little fluoresce will be observed in the UV logs and images while a sheen could be observed in an adjacent soil or groundwater sample.
- Will OIP-UV or G fluoresce DNAPL solvents?
No chlorinated DNAPL solvents will not fluoresce on their own without help from something else. Many chlorinated solvents like Trichloroethylene and Trichloroethane have been used as degreaser in industrial manufacturers. In this case there is a likelihood that the comingled oils and greases within the DNAPL will fluorescence under the OIP-UV excitation. We recommend a sample being collected and tested prior to mobilization for this purpose. Also, MIP can be used the track the chlorinated solvent plume from DNAPL to sub ppm levels.
Having the combo tool of OIP and HPT, we can find leaching pathways, not just for contaminated petroleum areas, but also for metals or something like that. We can hammer complex sites where there might be a lot of historical uses that led to a variety of contamination, and we can address it in one mobilization, reducing costs for the client up front, but also delivering this really comprehensive product at the back end.
- Loran Brooks, Engineer, Water & Environmental Technologies, Montana
Tooling & Instrumentation
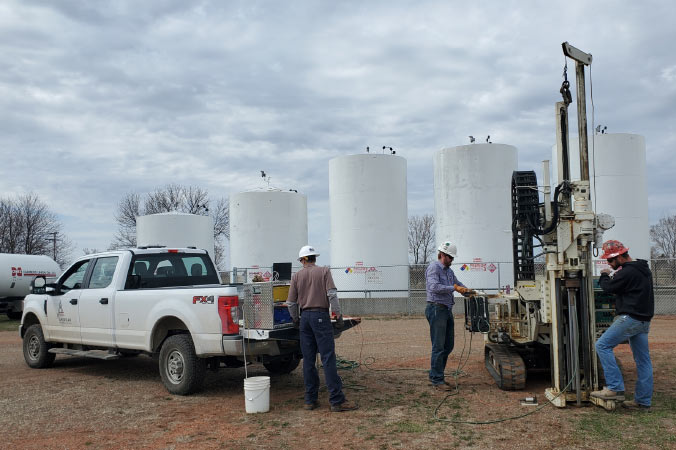
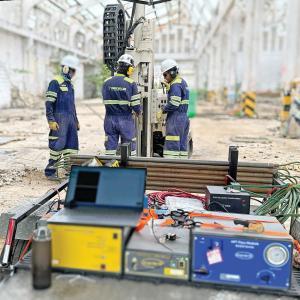
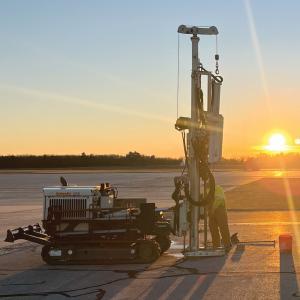
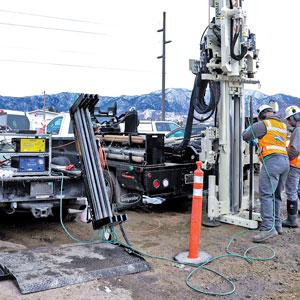
Geoprobe Systems® manufactures all of the equipment needed for OIHPT logging. This equipment can be divided into two basic categories: surface instrumentation (OIP interface, data acquisition, and HPT controller), and downhole probes (including probes, trunklines, connectors, etc.).
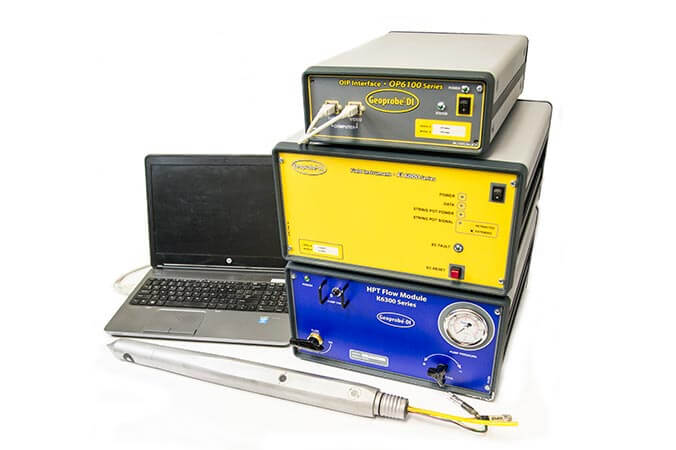
A basic set of OIHPT instruments is shown in Figure 7 and includes the following:
- OP6100 OIP Interface: This instrument regulates, controls and monitors power to the OIP power supply and sends the system control signals to the downhole tools. Images from the down hole camera are collected by the instrument and relayed to the computer via a USB connection.
- FI6000: Data acquisition instrument, acquires depth, EC, and HPT data if avilable and relays it to the computer via a USB connection. The FI6000 is the general data acquisition instrument used in all Geoprobe® DI logging systems (EC and HPT). It also provides the electrical conductivity measurement system associated with OIP.
- K6300 Series HPT Controller (Optional): This instrument regulates and measures injection water flow and pressure to the OIHPT probe. Data from this controller is sent to the FI6000 via a data cable.
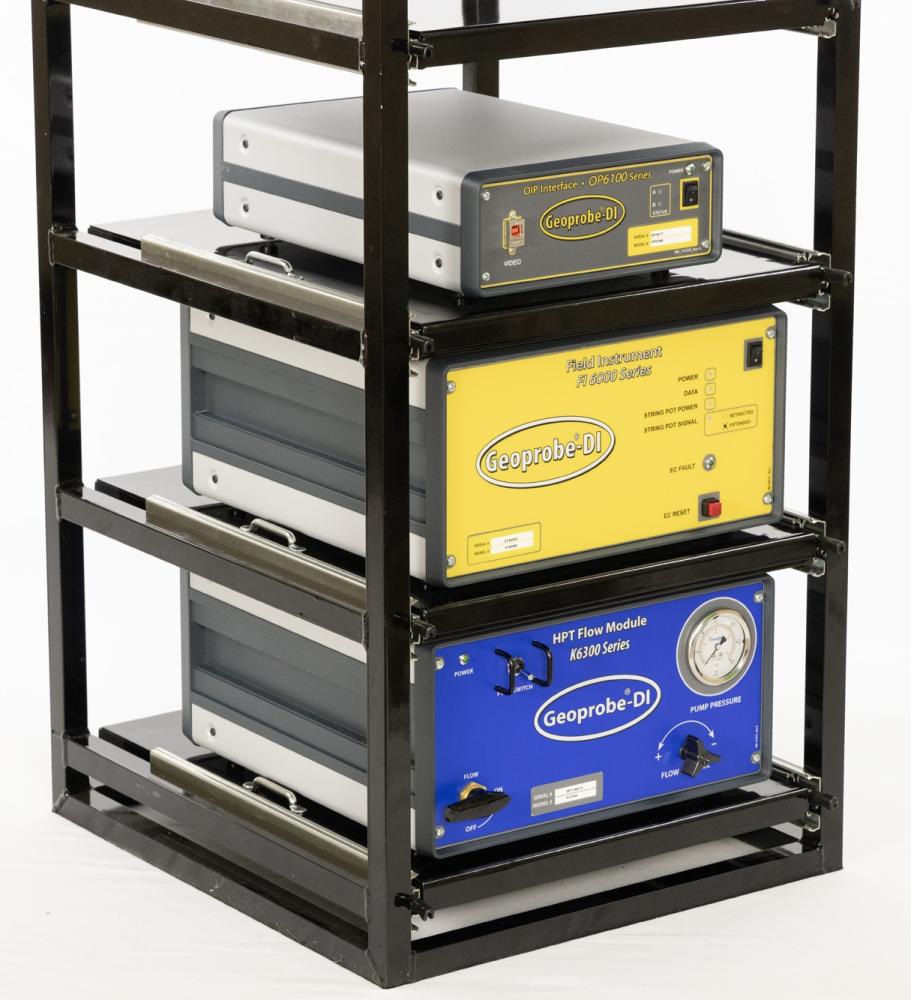
Figure 7:
OIHPT Instrumentation
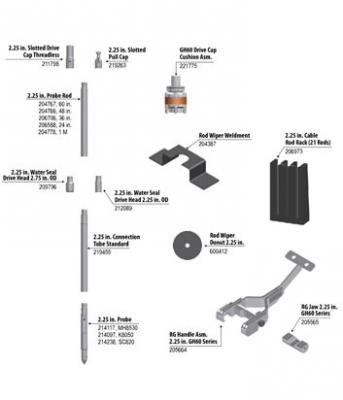
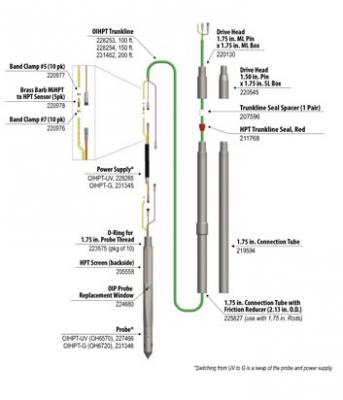
Basic downhole OIP equipment is shown in Figure 8. There are many variations and combinations of this tooling, depending on the contaminant type, depth requirement and the lithology or permeability sensors that are to be used in combination with the OIP. The standard, most commonly deployed components are shown below:
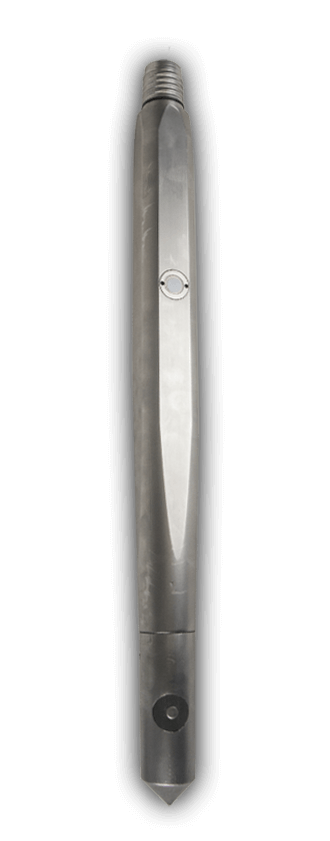
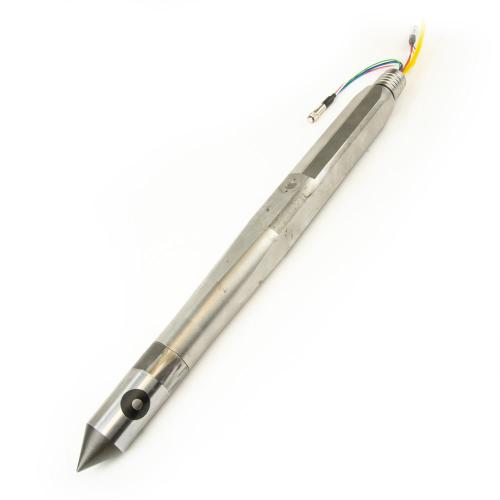
- OH6570 OIHPT-UV probe (MN 227466) 275nm UV and visible light sources with removable sapphire window, HPT screen and dipole electrical conductivity array.
- OIHPT Trunkline (MN 228254)/OIP Trunkline (MN 226362): 150 ft. (46m).
- Connection section and drive head. Power supply (OIP-UV MN 224692, OIHPT-UV MN 228265) and electrical connections are carried in this section.
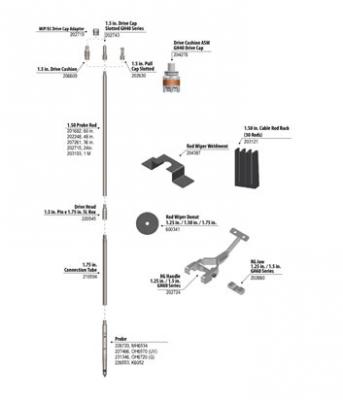
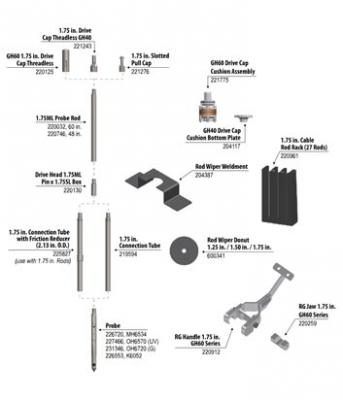
- Probe rods. Geoprobe® 1.75-inch (44mm) and 1.5-inch (38mm) rods are the most commonly used for MIP logging. Successive sections of these rods are added to push or percussion drive the probe to depth.
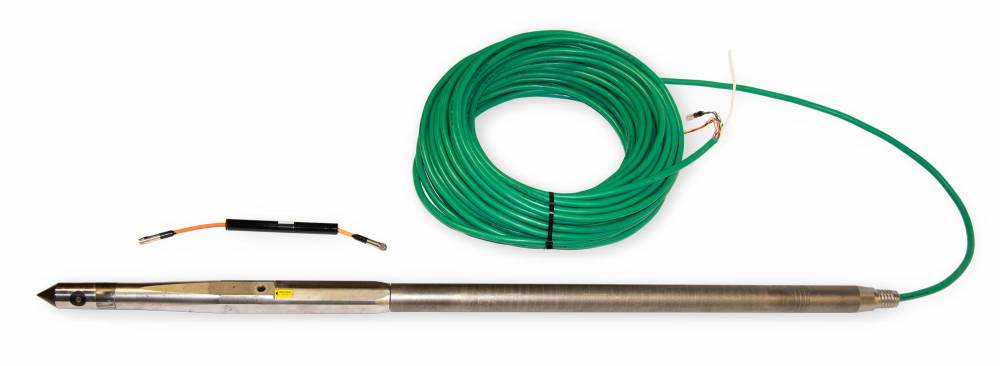
Figure 8:
OIHPT Probe, Power supply (ran inside the connection tube), connection tube and drive head which connect the the drive rods. The OIHPT trunkline connects the down-hole probe to the up-hole instruments.
Having HPT data along with the OIP-EC data provides the site investigator a powerful combination of logging tools. This tool provides the ability to simultaneously estimate soil permeability with the HPT, detect NAPL fluorescence with the OIP, and measure soil/pore fluid conductance with standard EC. The OIHPT probe and system can be operated with all sensors collecting data or it can be used to collect just HPT-EC data or just OIP-EC data depending upon project and weather considerations.
OIHPT-G probe utilizes a 520nm green laser diode to induce fluorescence on larger PAH contaminants such as Creosote, Coal Tars, Heavy Crude Oils and Bunker Fuels.
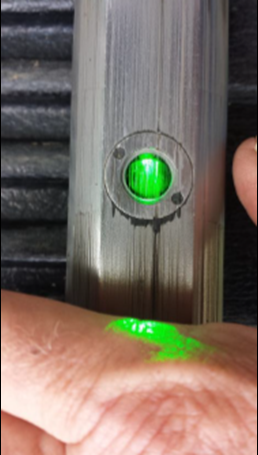
Figure 9:
OIHPT-G with a Green Light Source
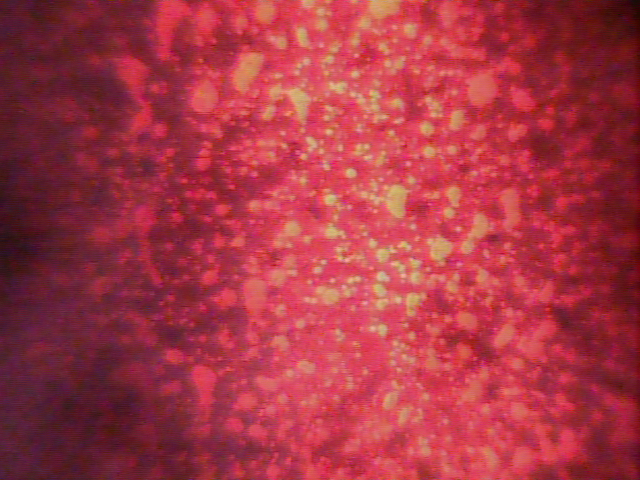
Figure 10:
OIP-G Fluorescence Image
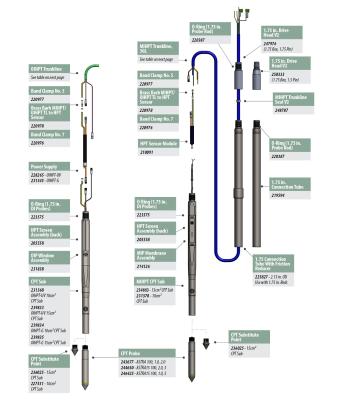
This OIHPT-CPT sub allows an operator to collect HPT injection pressure, OIP fuel fluorescence, and EC lithology along with CPT tip resistance, sleeve friction and U2 pore pressure when combined with the Nova cone. The tool can be operated without the NOVA cone by running with the thread solid point or with the NOVA cone by substituting the solid point with the NOVA cone. The OIHPT CPT sub is available in either ultraviolet-visible or green-infrared light source models depending upon the target contaminant requirements.
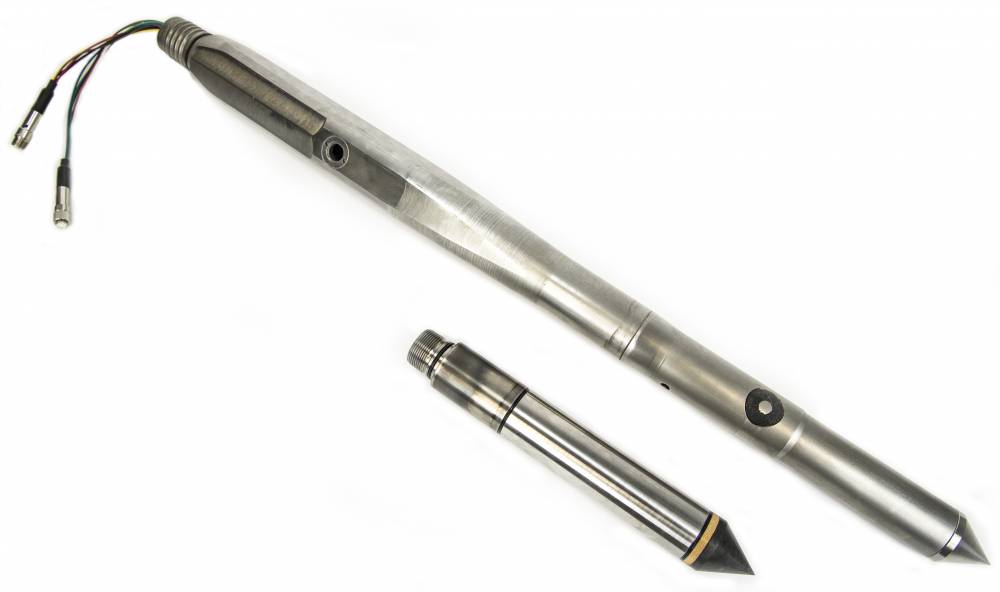
Figure 11:
OIHPT-CPT Sub used with the Astra Cone
Videos
ID: 1997
ID: 6608
ID: 1965
ID: 1995
ID: 1979
ID: 1998
Resources
Click on a section below to view information.

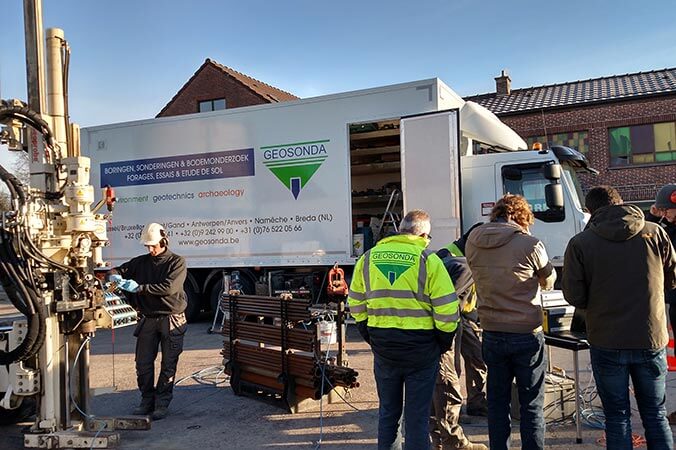
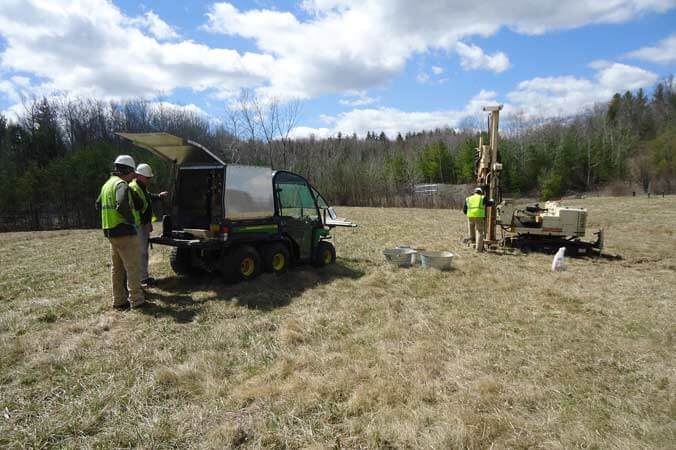
Equipment used and overall operation layout during a MIHPT location.
ID: 14618 | Date:
OIP-UVR provides added confidence when detecting lighter-end jet fuels.
ID: 14028 | Date:
Investing in OIHPT optical imaging system distinguishes services from other in region while providing clients a cost effective characterization.
ID: 12401 | Date:
Finkler Ambiental uses their Geoprobe® 6712DT in conjunction with Direct Image® MiHPT and OIP systems at a project site that serves as a storage plant for various fuels with more than 300 monitoring wells.
ID: 5774 | Date:
The Optical Imaging Profiler (OIP) is a new direct push photo-logging system developed by Geoprobe® that uses a down hole light source...
ID: 5245 | Date:

Depend on Team Geoprobe®
Since 1987, Geoprobe® has manufactured innovative drilling rigs and tooling - engineered for efficiency and safety - simplifying drillers’ jobs and empowering their companies to succeed as productive and profitable leaders in the industry. When you partner with Geoprobe® you receive:
Customer-inspired Innovation
Engineering and building industry-leading drilling rigs, tooling, and techniques for the technical driller based on your needs to work safer and more efficiently.
Exceptional Value
Ensuring drilling rigs and tooling are created in conjunction – with consistent quality – to collect the highest-quality information with the most accurate result to get you to, into, and through the job efficiently.
Superior Service
Equipping you to do your best job and keeping you in the field via one-on-one expert sales and service technicians manning live support phone lines, shipping necessary parts same-day.
What is Geoprobe® Direct Image® OIP?
- The OIP system produces a detailed log of induced fuel fluorescence with depth.
- A downhole camera operates at 30 frames per second (fps) to capture fuel fluorescence.
- The acquisition software analyzes each image for typical fuel fluorescence color.
- The results are the percent of the image area (up to 100%) that displays fuel fluorescence.
- Fluorescence images are saved in the log every 0.05ft (15mm) for review at a later time.
- OIP is simple to learn and operate.
- OIP log Interpretation is intuitive, made simple by the saved images to compare to the log.
- The OIP-UV probe contains both 275nm UV and visible LEDs. This tool is designed for common fuels and oils such as gasoline, diesel, jet fuel, motor, hydraulic and cutting oil.
- The OIP-G probe contains both 520nm LD and infrared LEDs. This tool is designed for heavier fuels and oils such as creosote, coal tars, crude oil and heavy bunker fuels.
- Able to automatically and manually capture visible soil images with the OIP-UV.
- Collect OIP fluorescence, EC, and HPT data with an optional probe configuration that includes CPT data.
Typical OIP-UV Log: Graphs (left to right) Soil Electrical Conductivity, HPT Pressure with Absolute Piezometric Pressure and Static Water Level, Fuel Fluorescence, depth specific Fluorescence Image, Estimated Hydraulic Conductivity (K)
OIP is a logging tool that uses real time analysis of fluorescence images to map position and relative concentration of non-aqueous phase hydrocarbons. Images are saved (20 per foot) in the log for later review and confirmation.
:
:
:
The OIP-UV is a tool for mapping light non-aqueous phase liquids (LNAPL), residual LNAPL, and light oils. The OIP-UV system utilizes a 275nm ultraviolet (UV) light emitting diode (LED) to produce fluorescence from the polycyclic aromatic hydrocarbons (PAHs) contained in fuels and light oils. The UV light is directed out a sapphire window in the side of the probe (Figure 1) onto the soil. When LNAPL level fuels are present, the PAH molecules will absorb the UV light energy and shortly afterwards emit a light photon (fluorophore) which is the resultant fluorescence. Directly behind the sapphire window, the onboard camera captures images of the soil and any fluorescence produced by hydrocarbon contaminants present. The acquisition software analyzes each pixel of the images taken for the presence of color typical of fuel fluorescence. If there is no fuel present in the formation, or it is not in high enough concentration, then the returned camera image will appear black or dark under the UV light source. The OIP acquisition software logs percent area fluorescence with depth. The OIP-UV probe contains a visible as well as UV LEDs. The visible images are useful for determination of soil color, texture and occasionally confirming the presence of fuel or oil LNAPL globules.
Figure 1: OIP Probe Schematic
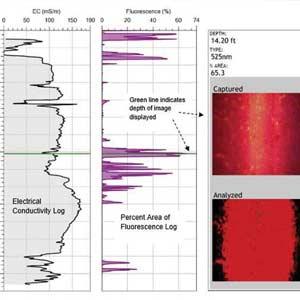
The camera within the OIP probe operates at 30 frames per second with the log % area fluorescence (%AF) value being an average of all the images taken over a 0.05ft (1.5cm) interval. As the log is reviewed in Direct Image® Viewer, the user can click on the log and a green line will show up across the log which corresponds to a specific depth. The image saved from that depth will display if the OIP Image Display graph is shown. In Figure 2 the depth of the displayed saved image is 24.20ft, it is a UV image with the actual image being displayed in the "captured" image section. The "analyzed" image indicates which pixels within the image display fluorescent color consistent with the color expected for fuel fluorescence. There are two colors that may show up in the analyzed image: red which corresponds to the darker blue colors of the image and green which corresponds to areas of high brightness either due to very low color saturation or high brightness of the image. This is used in an attempt to isolate out possible false mineral fluorescence. The overlaid image takes both the captured image and analyzed image and overlays them so the operator can identify areas that are being counted as fluorescence. Images are saved as the probe is moving for every 0.05ft. The red dots on the right side column of the image display graph are depths that "Still Images" were taken. This will contain both UV and visible light still images on the OIP-UV probe. The OIP-G fluorescence detector probe takes images using a 520nm green laser diode and an infrared LED.
Figure 2: OIP Fluorescence Log with Depth Specific Image and Software Image Analysis
The OIP system software saves 20 images per foot (65 per meter), an example portion of the saved images that an OIP-UV log would contain is shown in Figure 3. These images are saved as the OIP-UV probe is advanced into the subsurface with a typical OIP log containing hundreds of images and being a few hundred mb in size depending upon terminal log depth and amount of color present in the images. Where there is no NAPL or residual NAPL present the images are black, where hydrocarbon NAPL is present blue fluorescence is seen within the images.
Figure 3: Saved images from an OIP-UV log
:
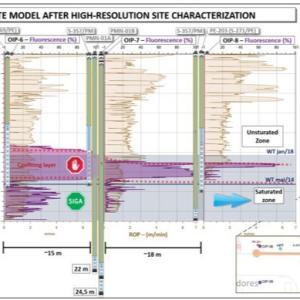
The OIHPT-UV Log in Figure 4 displays the following graphs (left to right) electrical conductivity, HPT injection pressure, OIP % image area fluorescence, depth specific saved UV images, depth specific saved visible images, and estimate of hydraulic conductivity (K). The red dots to the right of the saved images indicate locations of still UV and visible images saved in the file.
Figure 4: OIP-UV Log
The OIP-G log in Figure 5 was performed on a creosote site in the northeast US. The OIP-G probe, which induces fluorescence utilizing a 520nm green laser diode (LD), returns a fluorescence image in the orange-red color range as depicted in the saved images from 10-20ft in the right column of the log. The red dots are the saved still images which are taken with the 520nm green LD and an infrared (IR) LED.
Figure 5: OIP-G Log
When the probe is stopped to add rods, still images will be captured with both available light sources in the OIP probe. Still images can be captured at any time an operator desires by stopping the probe advancement and selecting a button in the software. The process only takes a few seconds to complete and probe advancement can resume. These still images provide greater image clarity and an opportunity to look at the soil and fuel under visible light. Visible images provide the investigator an opportunity to observe soil color and texture in-situ. Occasionally when hydrocarbon NAPL is present in a saturated sand formation NAPL globules are evident in both the UV and visible images (Figure 6).
Figure 6: Collocated UV and Visible Still Images
DI Viewer is a free program downloadable from the link below which allows the user to display any of the Direct Image® log types (MIP, OIP, HPT, EC). With this program the user can display the raw data .zip files of each saved graph of an individual log in single log view or compare them to other logs using the overlay and cross sectional view functions. Log specific QA data is also accessible with this software which also allows one to print or export the logs data for 3D modeling or into .jpg or .png files.
: