
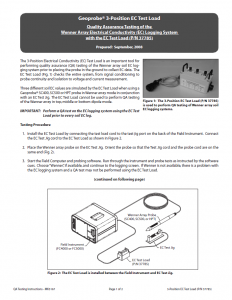
Continuous Log of Soil Conductivity with Depth
Geoprobe® EC (Electrical Conductivity) yields lithologic information of soil conductivity and is easy to learn and operate. It is useful to map brine/seawater plumes and is incorporated into all other Geoprobe® Direct Image® logging tools.
= Tool String Diagram (TSD)
EC Overview
Soil conductivity and resistivity (the inverse of conductivity) have long been used as tools to classify soils. The power of this tool stems from the fact that, in general, silts and clays exhibit higher electrical conductivity readings than sands and gravels. The conductance of the soil is based upon its parent mineralogy as well as the conductance of the pore fluids within the formation. As with any of the Direct Image® logging tools, the collection of a few confirmation soil samples, either from discrete depths or a continuous core, should be used to verify the lithology represented by electrical conductivity values at a site. The electrical logs are then correlated across the site to show changes in thickness or elevation of lithologic units of interest. To best understand subsurface lithology and permeability, soil conductivity measurements should be incorporated with permeability measurements of the HPT system.
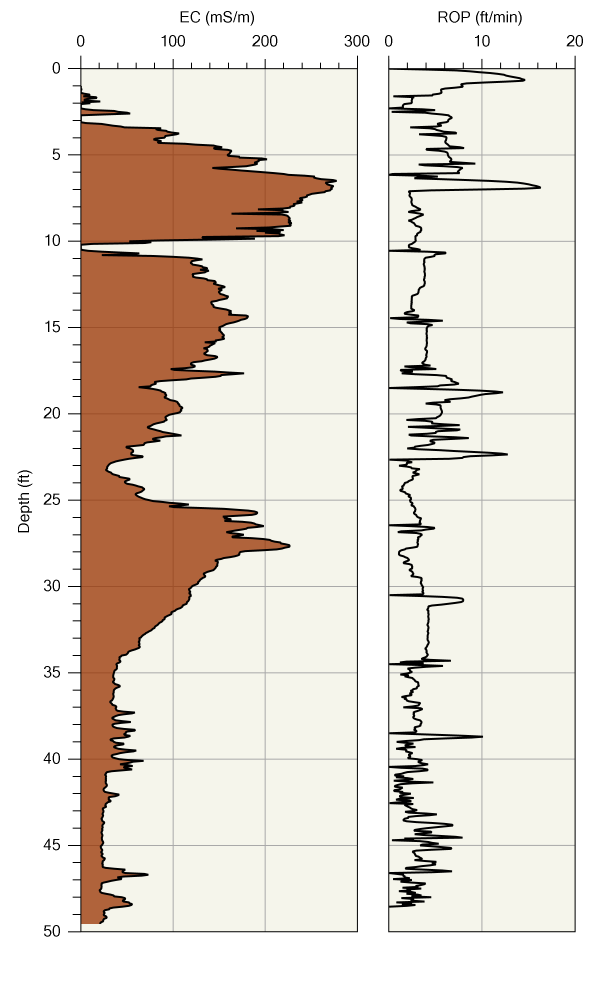
An EC log displaying soil EC (left) with rate of push (right). The first 30 ft. is primarily fine grained soils with some slightly coarser seams. The soils transition into coarse grained material below 34 ft.
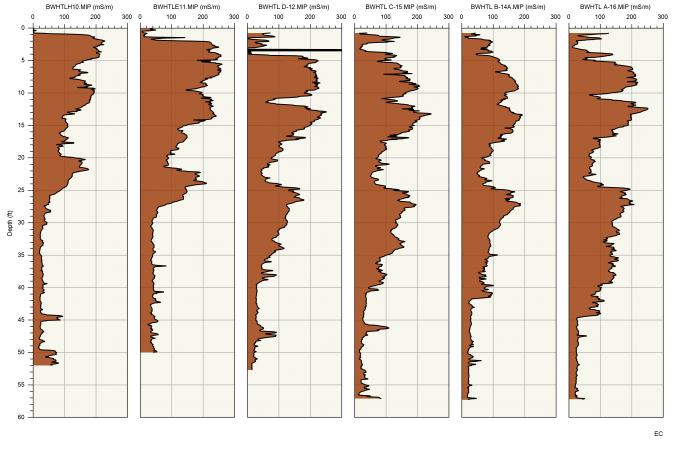
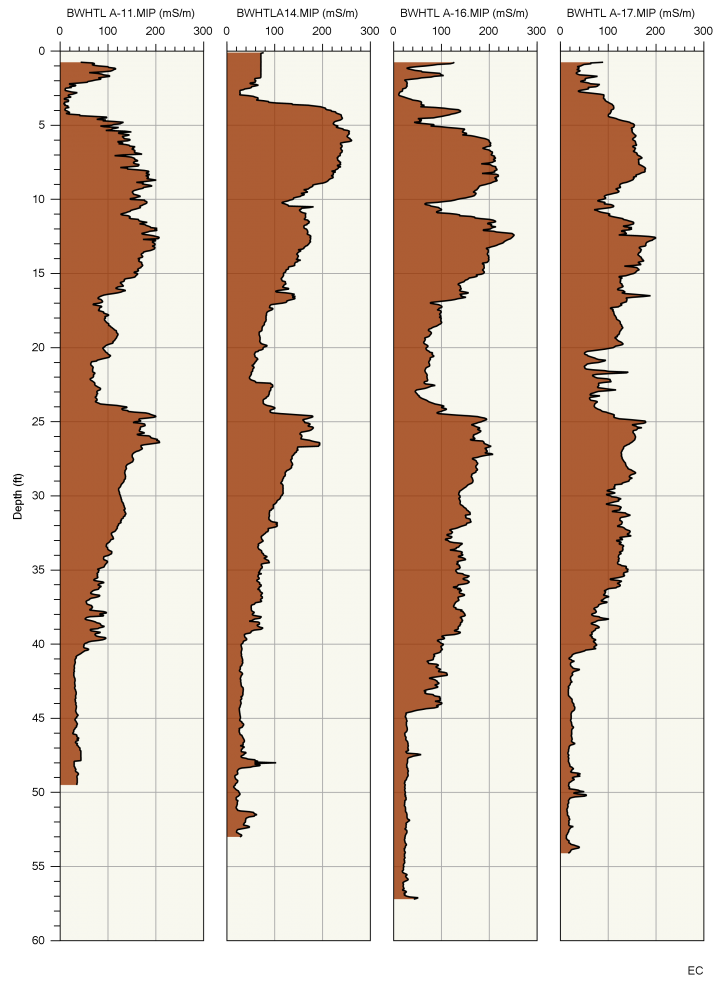
EC is used to provide an indication of lithology of the subsurface. This may be to determine the location of high permeability zones within the aquifer. This information can be used to pinpoint the most productive zones to place a private of municipal well or to understand the contaminant migration pathways of a site. It is these permeable zones which allow contaminants (hydrocarbons, chlorinated VOCs, or metals) to be transported in the subsurface. When observing a series of logs in a cross sectional view one can visualize how these preferential pathways connect across a site. The 4 EC logs shown below in indicate primarily finer grained soils near the surface with coarser grained zones at 10ft and 16ft- 24ft. Finer grained soils transition into coarse grained soils at depths ranging from 40ft-45ft across the site. The lithologic information gathered with the EC graphs can be used to aid the investigator in understanding the movement and location of contaminants in the subsurface. This information is even more powerful when coupled with the HPT (hydraulic profiling tool).
A cross section of EC logs highlighting how the lithology changes across the site.
Principles of Operation
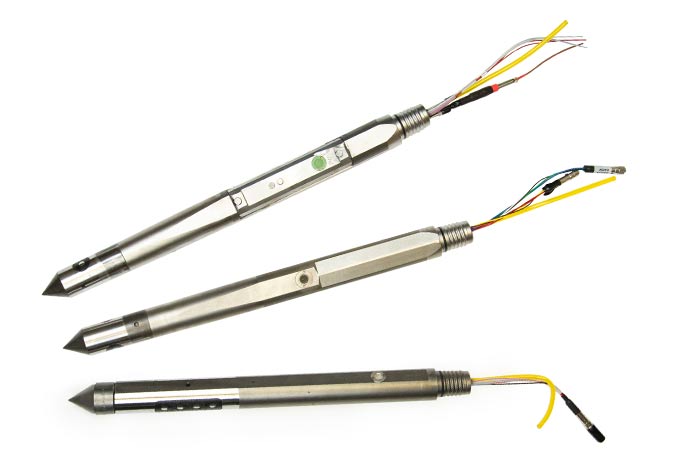
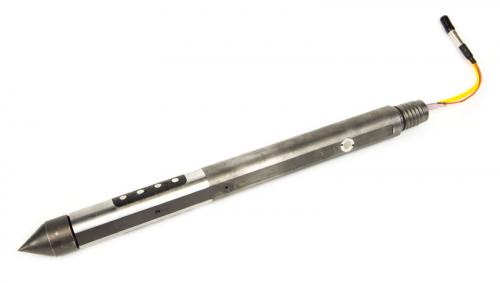
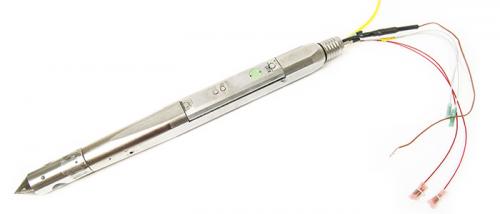
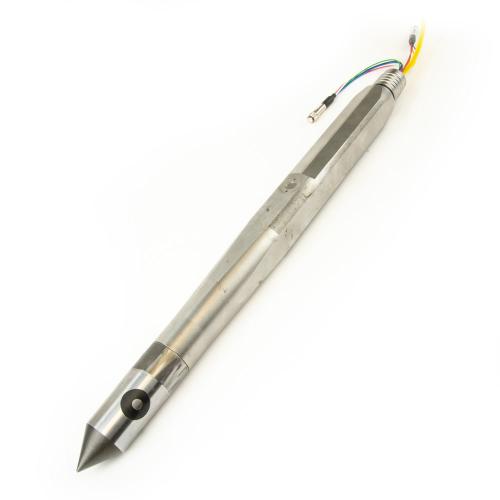
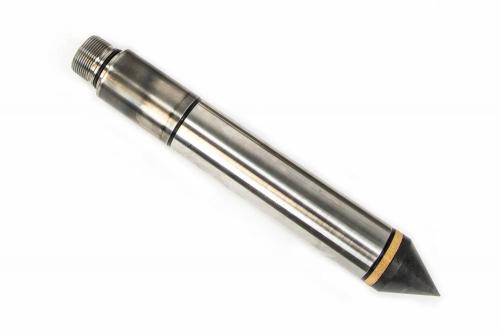
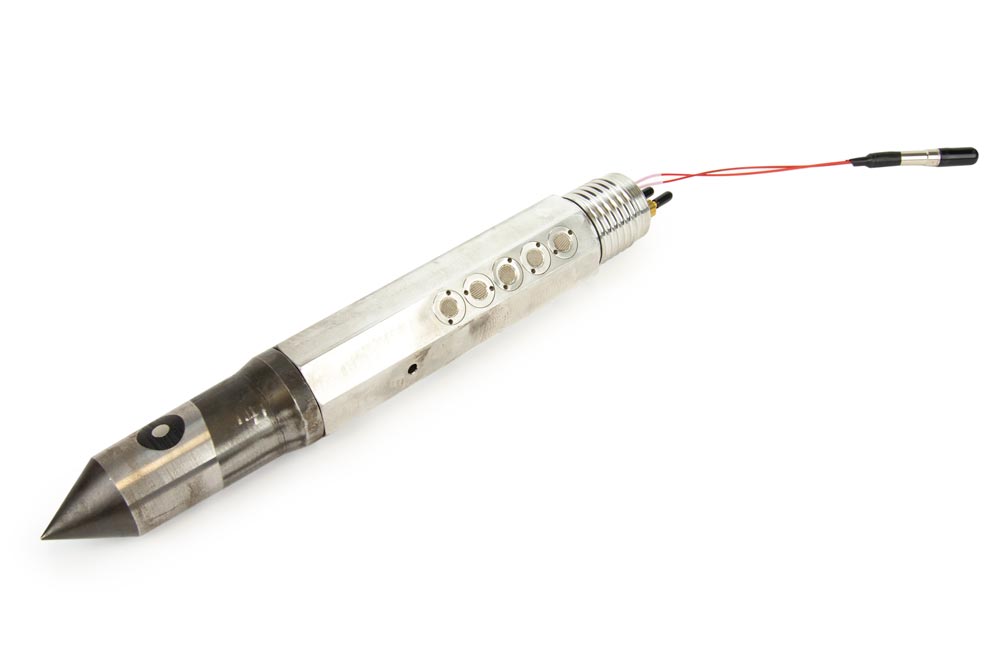
The EC probes come in two different configurations, Dipole Array and Wenner Array, with the same theory of operation. A current is sent through the formation between two probe contacts. This current is measured along with the voltage that results. The conductivity is a ratio of current to voltage times a constant. The resulting reading is in milli-Siemens per meter (mS/m).
Array for Conductivity Measurements
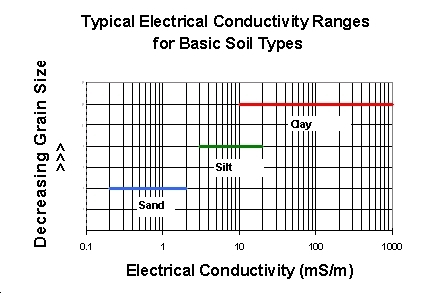
Soil conductivity, in general, varies with grain size. Finer grained soils, such as silts or clays, tend to produce higher EC signals than coarser grained sand and gravels. The figure below indicates that while specific values cannot be assigned to each soil type, in general each soil type should provide a different response on a specific site. The coarser grained sediments will allow the migration of contaminants and the finer grained sediments will trap and store contaminants. The EC gives the investigator real-time, on-screen logs allowing onsite decisions.
Generalized graph of potential soil EC values. Soil EC values are also influenced by the ionic strength of the soil pore water. Brine contaminated soils may exhibit EC values higher than normal soil ranges.
Combined Logging Tools
Electrical conductivity has been combined with the following logging tools:
HPT: The HPT provides a measurement of the injection pressure of a set flow of water into the formation. EC and HPT are very useful companion measurements which often mirror one another such as: courser grained materials - results in low injection pressure - means zone of higher permeability. Often they will diverge from one another which helps provide us with more information to better understand if there are ionic influences or some other factor influencing permeability.
MIP: The MIP heated membrane enhances volatilization of VOCs to allowing them to diffuse through the membrane and into an inert carrier gas stream. The carrier gas is analyzed by surface detectors mapping the position and relative concentration of VOC contaminants in the subsurface. Sensors on the MIP probe include soil EC, HPT pressure and MIP VOC detection. Knowing information about the lithology where contaminants are present is helpful.
OIP: The OIP induces fluorescence of LNAPL fuels and light oils by shining a UV light source out a sapphire window in the probe. Resultant fuel fluorescence images are then captured by an onboard camera and analyzed for color. Onboard sensors of the OIP probe include soil EC, HPT pressure and OIP fuel fluorescence.
CPT: This combined tool string incorporates a CPT lithology parameters of tip resistance, sleeve friction and pore pressure onto subs containing either EC-HPT, EC-HPT-MIP, or EC-HPT-OIP.
HPT-GW: This unique tool allows us to perform HPT and EC logging and then stop and collect groundwater samples at appropriate depths in the same push.
Features & Options
Soil conductivity and resistivity (the inverse of conductivity) have long been used as tools to classify soils. The power of this tool stems from the fact that, in general, silts and clays exhibit higher electrical conductivity readings than sands and gravels. The conductance of the soil is based upon its parent mineralogy as well as the conductance of the pore fluids within the formation. As with any of the Direct Image® logging tools, the collection of a few confirmation soil samples, either from discrete depths or a continuous core, should be used to verify the lithology represented by electrical conductivity values at a site. The electrical logs are then correlated across the site to show changes in thickness or elevation of lithologic units of interest. To best understand subsurface lithology and permeability, soil conductivity measurements should be incorporated with permeability measurements of the HPT system.
An EC log displaying soil EC (left) with rate of push (right). The first 30 ft. is primarily fine grained soils with some slightly coarser seams. The soils transition into coarse grained material below 34 ft.
EC is used to provide an indication of lithology of the subsurface. This may be to determine the location of high permeability zones within the aquifer. This information can be used to pinpoint the most productive zones to place a private of municipal well or to understand the contaminant migration pathways of a site. It is these permeable zones which allow contaminants (hydrocarbons, chlorinated VOCs, or metals) to be transported in the subsurface. When observing a series of logs in a cross sectional view one can visualize how these preferential pathways connect across a site. The 4 EC logs shown below in indicate primarily finer grained soils near the surface with coarser grained zones at 10ft and 16ft- 24ft. Finer grained soils transition into coarse grained soils at depths ranging from 40ft-45ft across the site. The lithologic information gathered with the EC graphs can be used to aid the investigator in understanding the movement and location of contaminants in the subsurface. This information is even more powerful when coupled with the HPT (hydraulic profiling tool).
A cross section of EC logs highlighting how the lithology changes across the site.
The EC probes come in two different configurations, Dipole Array and Wenner Array, with the same theory of operation. A current is sent through the formation between two probe contacts. This current is measured along with the voltage that results. The conductivity is a ratio of current to voltage times a constant. The resulting reading is in milli-Siemens per meter (mS/m).
Array for Conductivity Measurements
Soil conductivity, in general, varies with grain size. Finer grained soils, such as silts or clays, tend to produce higher EC signals than coarser grained sand and gravels. The figure below indicates that while specific values cannot be assigned to each soil type, in general each soil type should provide a different response on a specific site. The coarser grained sediments will allow the migration of contaminants and the finer grained sediments will trap and store contaminants. The EC gives the investigator real-time, on-screen logs allowing onsite decisions.
Generalized graph of potential soil EC values. Soil EC values are also influenced by the ionic strength of the soil pore water. Brine contaminated soils may exhibit EC values higher than normal soil ranges.
Electrical conductivity has been combined with the following logging tools:
HPT: The HPT provides a measurement of the injection pressure of a set flow of water into the formation. EC and HPT are very useful companion measurements which often mirror one another such as: courser grained materials - results in low injection pressure - means zone of higher permeability. Often they will diverge from one another which helps provide us with more information to better understand if there are ionic influences or some other factor influencing permeability.
MIP: The MIP heated membrane enhances volatilization of VOCs to allowing them to diffuse through the membrane and into an inert carrier gas stream. The carrier gas is analyzed by surface detectors mapping the position and relative concentration of VOC contaminants in the subsurface. Sensors on the MIP probe include soil EC, HPT pressure and MIP VOC detection. Knowing information about the lithology where contaminants are present is helpful.
OIP: The OIP induces fluorescence of LNAPL fuels and light oils by shining a UV light source out a sapphire window in the probe. Resultant fuel fluorescence images are then captured by an onboard camera and analyzed for color. Onboard sensors of the OIP probe include soil EC, HPT pressure and OIP fuel fluorescence.
CPT: This combined tool string incorporates a CPT lithology parameters of tip resistance, sleeve friction and pore pressure onto subs containing either EC-HPT, EC-HPT-MIP, or EC-HPT-OIP.
HPT-GW: This unique tool allows us to perform HPT and EC logging and then stop and collect groundwater samples at appropriate depths in the same push.
Resources
Click on a section below to view information.


| EC Probe | EC Array |
|---|---|
| SC400 EC |
Wenner, 1.25 in. rod Wenner – 4 electrodes, 3 in. (76 mm) length Dipole – 2 electrodes, 1 in. (25 mm) length |
| SC520 EC |
Wenner, 1.5 in. rod Wenner – 4 electrodes, 3 in. (76 mm) length Dipole – 2 electrodes, 1 in. (25 mm) length |
| SC820 EC |
Wenner, 2.25 in. rod Wenner – 4 electrodes, 3 in. (76 mm) length Dipole – 2 electrodes, 1 in. (25 mm) length |
| HPT Probe | EC Array |
|---|---|
| K6050 HPT-EC |
Wenner, 1.25 in. rod Wenner – 4 electrodes, 3 in. (76 mm) length Dipole – 2 electrodes, 1 in. (25 mm) length |
| K8050 HPT-EC |
Wenner, 2.25 in. rod Wenner – 4 electrodes, 3 in. (76 mm) length Dipole – 2 electrodes, 1 in. (25 mm) length |
| KS8050 HPT-EC- GW Sampling |
Wenner, 2.25 in. rod Wenner – 4 electrodes, 3 in. (76 mm) length Dipole – 2 electrodes, 1 in. (25 mm) length |
| MIP Probe | EC Array |
|---|---|
| MP6520 MIP-EC |
Dipole (Button) - 1.5 in. rods Dipole – 2 electrodes, 0.375 in. (9.5 mm) length |
| MP8520 MIP-EC |
Dipole (Button) - 2.25 in. rods Dipole – 2 electrodes, 0.375 in. (9.5 mm) length |
| MH6530 MIP-HPT-EC |
Dipole (Button) - 1.5 in. rods Dipole – 2 electrodes, 0.375 in. (9.5 mm) length |
| MH8530 MIP-HPT-EC |
Dipole (Button) - 2.25 in. rods Dipole – 2 electrodes, 0.375 in. (9.5 mm) length |
| MP4520 MIP-CPT-EC |
Dipole (Button) - 1.5 in. rods Dipole – 2 electrodes, 0.375 in. (9.5 mm) length |
| MP4525 MIP-CPT-EC |
Dipole (Button) - 1.5 in. rods Dipole – 2 electrodes, 0.375 in. (9.5 mm) length |
Depend on Team Geoprobe®
Since 1987, Geoprobe® has manufactured innovative drilling rigs and tooling - engineered for efficiency and safety - simplifying drillers’ jobs and empowering their companies to succeed as productive and profitable leaders in the industry. When you partner with Geoprobe® you receive:
Customer-inspired Innovation
Engineering and building industry-leading drilling rigs, tooling, and techniques for the technical driller based on your needs to work safer and more efficiently.
Exceptional Value
Ensuring drilling rigs and tooling are created in conjunction – with consistent quality – to collect the highest-quality information with the most accurate result to get you to, into, and through the job efficiently.
Superior Service
Equipping you to do your best job and keeping you in the field via one-on-one expert sales and service technicians manning live support phone lines, shipping necessary parts same-day.
Soil conductivity and resistivity (the inverse of conductivity) have long been used as tools to classify soils. The power of this tool stems from the fact that, in general, silts and clays exhibit higher electrical conductivity readings than sands and gravels. The conductance of the soil is based upon its parent mineralogy as well as the conductance of the pore fluids within the formation. As with any of the Direct Image® logging tools, the collection of a few confirmation soil samples, either from discrete depths or a continuous core, should be used to verify the lithology represented by electrical conductivity values at a site. The electrical logs are then correlated across the site to show changes in thickness or elevation of lithologic units of interest. To best understand subsurface lithology and permeability, soil conductivity measurements should be incorporated with permeability measurements of the HPT system.
: An EC log displaying soil EC (left) with rate of push (right). The first 30 ft. is primarily fine grained soils with some slightly coarser seams. The soils transition into coarse grained material below 34 ft.
EC is used to provide an indication of lithology of the subsurface. This may be to determine the location of high permeability zones within the aquifer. This information can be used to pinpoint the most productive zones to place a private of municipal well or to understand the contaminant migration pathways of a site. It is these permeable zones which allow contaminants (hydrocarbons, chlorinated VOCs, or metals) to be transported in the subsurface. When observing a series of logs in a cross sectional view one can visualize how these preferential pathways connect across a site. The 4 EC logs shown below in indicate primarily finer grained soils near the surface with coarser grained zones at 10ft and 16ft- 24ft. Finer grained soils transition into coarse grained soils at depths ranging from 40ft-45ft across the site. The lithologic information gathered with the EC graphs can be used to aid the investigator in understanding the movement and location of contaminants in the subsurface. This information is even more powerful when coupled with the HPT (hydraulic profiling tool).
: A cross section of EC logs highlighting how the lithology changes across the site.
:
:
The EC probes come in two different configurations, Dipole Array and Wenner Array, with the same theory of operation. A current is sent through the formation between two probe contacts. This current is measured along with the voltage that results. The conductivity is a ratio of current to voltage times a constant. The resulting reading is in milli-Siemens per meter (mS/m).
: Array for Conductivity Measurements
Soil conductivity, in general, varies with grain size. Finer grained soils, such as silts or clays, tend to produce higher EC signals than coarser grained sand and gravels. The figure below indicates that while specific values cannot be assigned to each soil type, in general each soil type should provide a different response on a specific site. The coarser grained sediments will allow the migration of contaminants and the finer grained sediments will trap and store contaminants. The EC gives the investigator real-time, on-screen logs allowing onsite decisions.
: Generalized graph of potential soil EC values. Soil EC values are also influenced by the ionic strength of the soil pore water. Brine contaminated soils may exhibit EC values higher than normal soil ranges.
:
: