
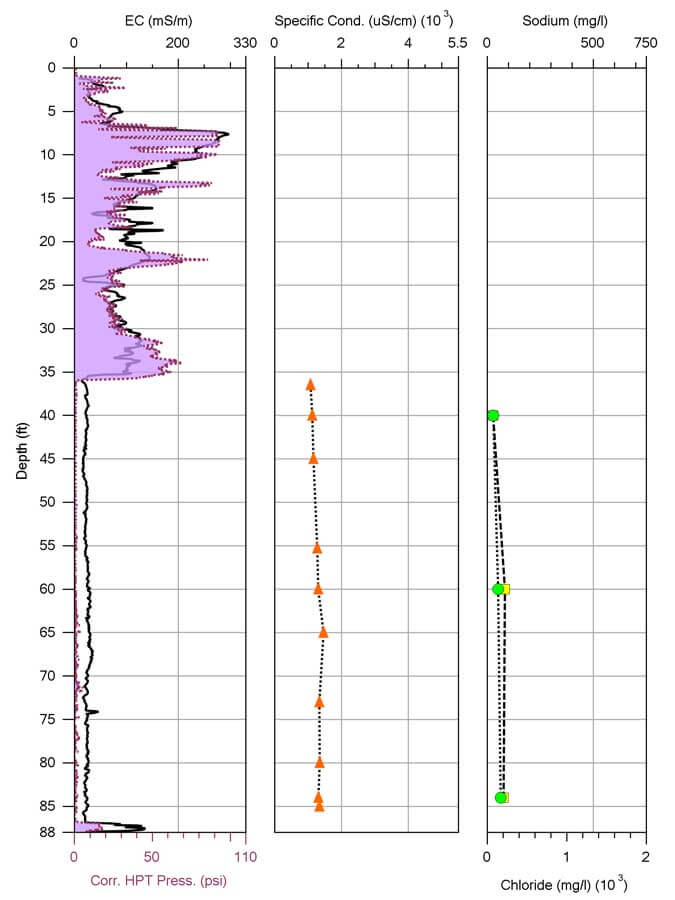
Figure 1: Background Log - Purple = Corrected HPT Pressure; Black = EC; Orange = Groundwater Specific Conductance; Yellow = Sodium; and Green = Chloride.
Last summer Wes McCall and Geoprobe® summer intern Mateus Evald conducted field tests with the Hydraulic Profiling Tool–Groundwater Sampler (HPT-GWS) in a local alluvial aquifer in Kansas. Their test results provide a good example of how to use HPT log data to identify brine impact on a fresh water aquifer.
At the background location, a plot of corrected HPT pressure over Electrical Conductivity (EC) allowed them to see the upper 35 feet of the formation exhibit relatively high EC and HPT pressure correlating with the sandy to silty clays in the upper part of the formation (Figure 1). Below 35 feet, low, flat HPT pressure and low, flat EC responses indicated the presence of clean sands and gravels. Dissipation tests indicated the local water level was just above 30 feet so the sand-gravel materials were all saturated with groundwater. Much of the bulk formation EC measured in a saturated, clean sand and gravel formation is the result of the specific conductance of the contained groundwater. Dry sand and gravel typically will have a bulk EC of less than 2 or 3 mS/m (milliSiemens /meter). At the background location, the bulk formation EC was around 30mS/m in the saturated sand and gravel.
A few hundred feet to the northwest of the background location, the EC log and water quality data are markedly different (Figure 2). While the HPT pressure remained low and flat in the saturated sand and gravel, the EC log displayed definite increases with depth. Groundwater profile samples here also displayed distinct increases in specific conductance, and sodium and chloride concentrations versus depth. It became evident from this data that increases in bulk formation EC, while the corrected HPT pressure remains low, indicated an increase in dissolved ions (salts/brines). At this site it was evident that plots of corrected HPT pressure over the EC log become an effective tool to identify brine impact to otherwise freshwater formations.
A complete presentation about this project and use of the EC/HPT comparison data can be found at www.geoprobe.com/hpt-gws.
Our summer intern, Mateus, is now back in Brazil, enrolled in the Federal University of Pelotas (Universidade Federal de Pelotas).
Contact Us
1835 Wall Street
Salina, Kansas 67401
Phone: (785) 825-1842
Photo Gallery
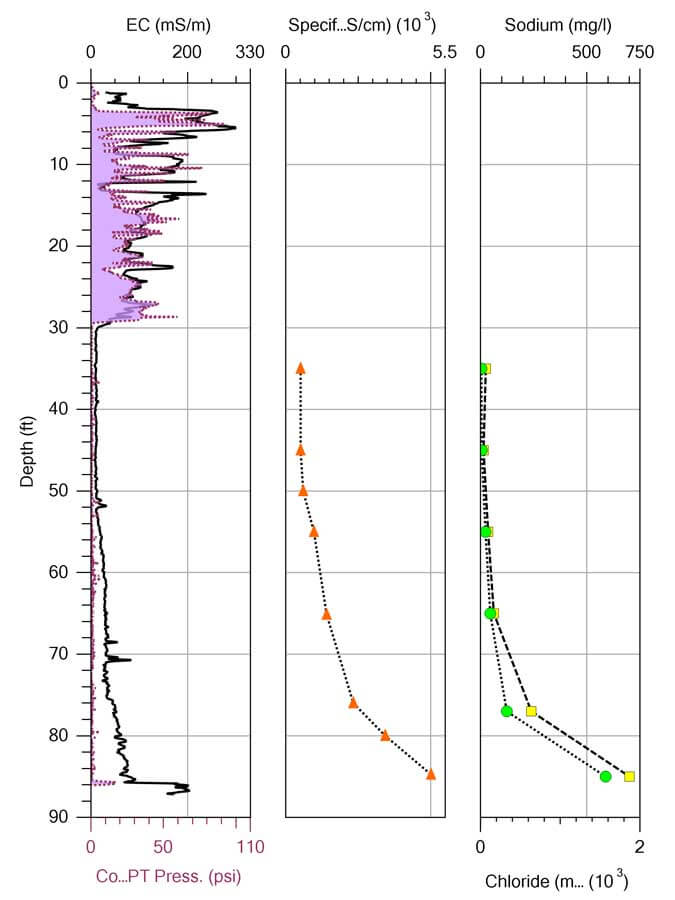
Figure 1: Background Log - Purple = Corrected HPT Pressure; Black = EC; Orange = Groundwater Specific Conductance; Yellow = Sodium; and Green = Chloride.
Figure 2: Brine-impacted Log - Purple = Corrected HPT Pressure; Black = EC; Orange = Groundwater Specific Conductance; Yellow = Sodium; and Green = Chloride.
Wes McCall - Geoprobe® Geologist - 1-785-404-1147 - mccallw@geoprobe.com
Related Videos
ID: 1960
ID: 1991
ID: 1992
ID: 1954
ID: 1965
ID: 279