
Log Water Injection Pressure which Provides Formation Permeability with Depth in Soil
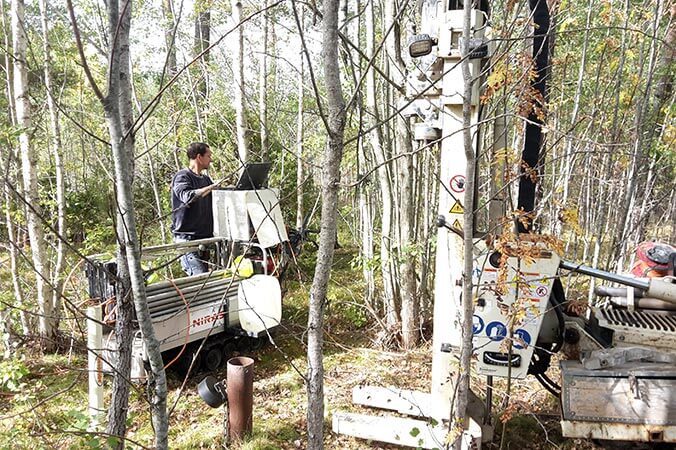
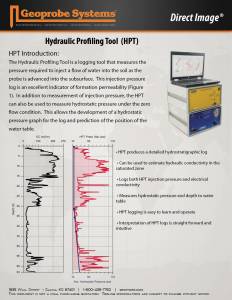
The HPT (hydraulic profiling tool) is a logging tool that measures the pressure required to inject a set flow of water into the soil as the probe is advanced into the subsurface. This injection pressure log is an excellent indicator of formation permeability. In addition to measurement of injection pressure, HPT profiling tools can also be used to measure hydrostatic pressure under the zero flow condition. This allows the development of an absolute piezometric pressure profile for the log and prediction of the position of the water table. The piezometric profile can be used to calculate the corrected HPT pressure. This data along with the flow rate can then be used to calculate an estimate of hydraulic conductivity (K) in the saturated formation.
= Tool String Diagram (TSD)
HPT Overview
What is Geoprobe® Direct Image® HPT?
- HPT produces a detailed log of relative formation permeability
- Can be used to estimate hydraulic conductivity in the saturated zone
- Logs HPT injection pressure, flow rate and electrical conductivity
- Use pressure dissipation tests to measure hydrostatic pressure
- Determine piezometric profile and water table depth
- Can be used estimate groundwater specific conductance to map brine contaminant plumes
- HPT logging is easy to learn and operate
- Interpretation of HPT logs is straight forward and intuitive
The Hydraulic Profiling Tool is a logging tool that measures the pressure required to inject a set flow of water into the soil as the probe is advanced into the subsurface. This injection pressure log is an excellent indicator of formation permeability. In addition to measurement of injection pressure, the HPT can also be used to measure hydrostatic pressure under the zero flow condition. This allows the development of an absolute piezometric pressure profile for the log and prediction of the position of the water table. The piezometric profile can be used to calculate the corrected HPT pressure. This data along with the flow rate can then be used to calculate an estimate of hydraulic conductivity (K) in the saturated formation. The injection pressure along with electrical conductivity can be used to estimate groundwater specific conductance where the formation allows.
Video:
Hydraulic Profiling Tool (HPT) Overview
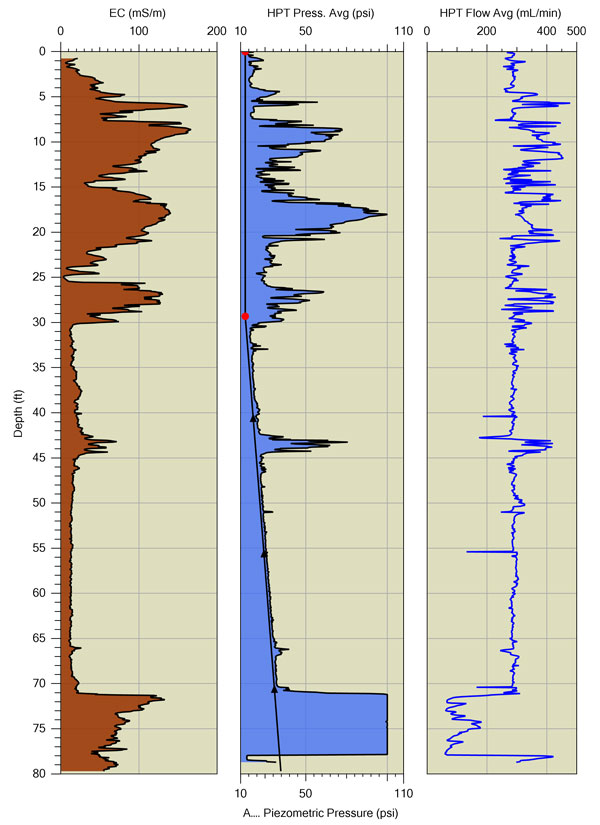
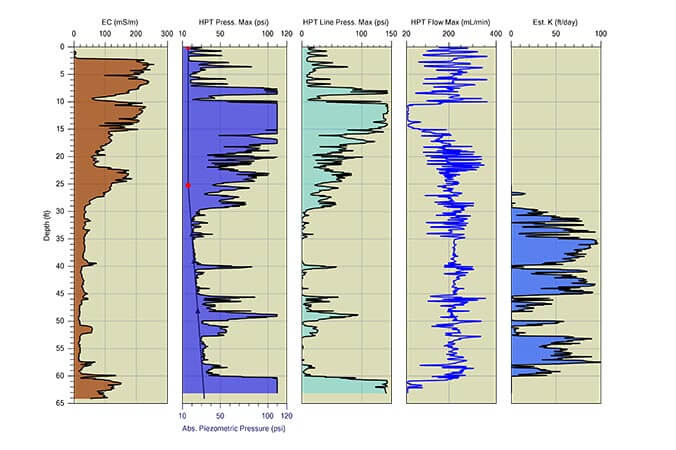
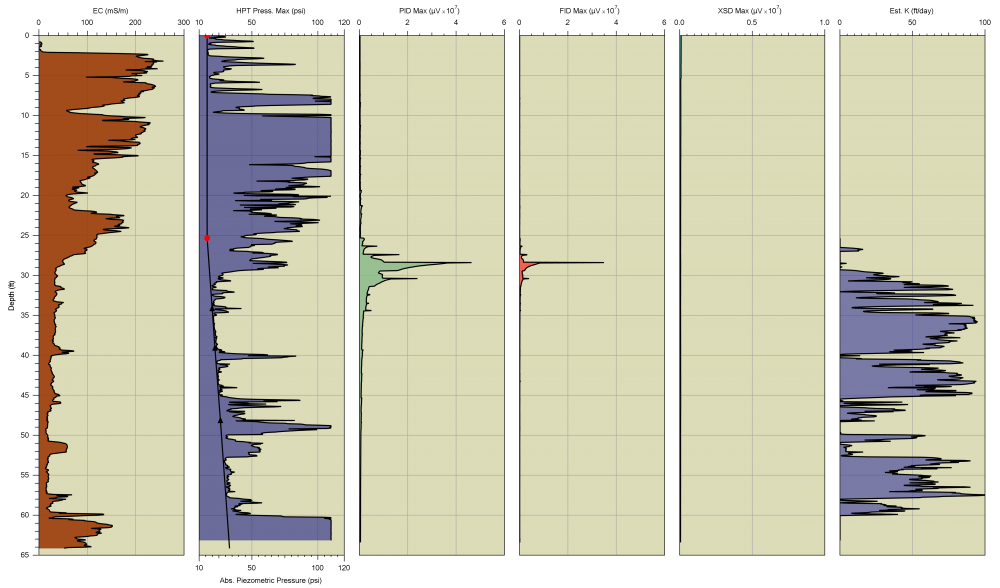
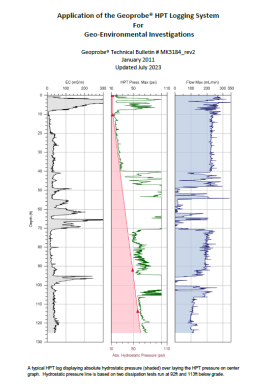
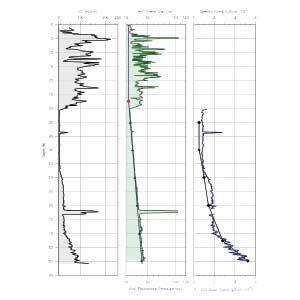
Typical HPT Log:
Graphs (left to right) electrical conductivity (EC), HPT injection pressure (top axis/blue fill) with the absolute piezometric pressure profile plotted (bottom axis/black line) and HPT flow rate. The bottom three triangles on the absolute piezometric pressure line represent hydrostatic pressure measurement points. The inflection point (red dot) in the absolute piezometric pressure line is the predicted water table.
Principles Of Operation
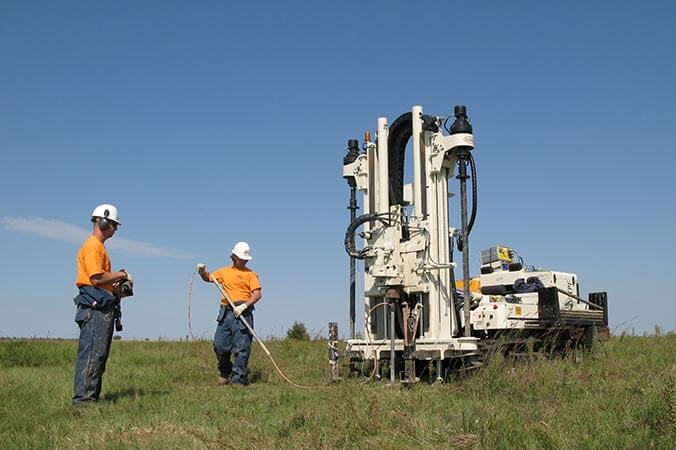
A general equipment setup is displayed below. Water from a supply tank (A) is pumped by the HPT controller (B) at a set flow rate through the trunkline (D) and into the formation after passing through the injection screen (F). Measurement of the injection pressure in the HPT system is made using a downhole pressure transducer (E). Use of a transducer in the downhole position allows measurement of the injection pressure at the HPT screen only and excludes frictional losses through the flow tube of the HPT trunkline. The downhole transducer position is also necessary for making hydrostatic pressure measurements at the probe.
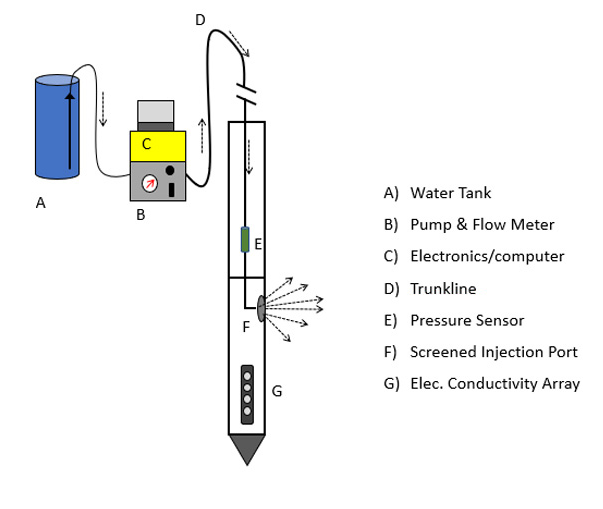
Schematic of primary HPT components and operation
Example Logs
HPT logs can provide a clear understanding of the subsurface lithology by combining soil electrical conductivity (EC) with HPT injection pressure. With the EC a small voltage is past between dipoles on the probe moving through the soil and pore fluids. Depending upon the soil mineralogy and pore fluid conductance a relative electrical conductivity is measured. HPT measures the pressure required to inject a set flow of water into the formation which is independent of the subsurface chemistry.
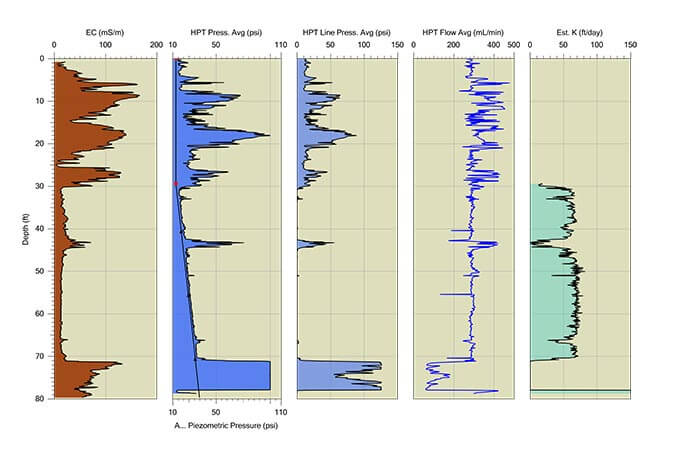
The logs below include (from left to right) an EC, HPT injection pressure (top axis) with absolute piezometric pressure (bottom axis), HPT line pressure, HPT flow rate and estimated hydraulic conductivity (K). The absolute piezometric pressure and estimated hydraulic conductivity graphs are calculated parameters typically performed after the logs is complete. These graphs use dissipation test information (dissipation of HPT Injection pressure leaving atmospheric and hydrostatic pressure) in their calculations for determining the static water level and K. The rest of the graphs are measured in-situ during tool advancement.
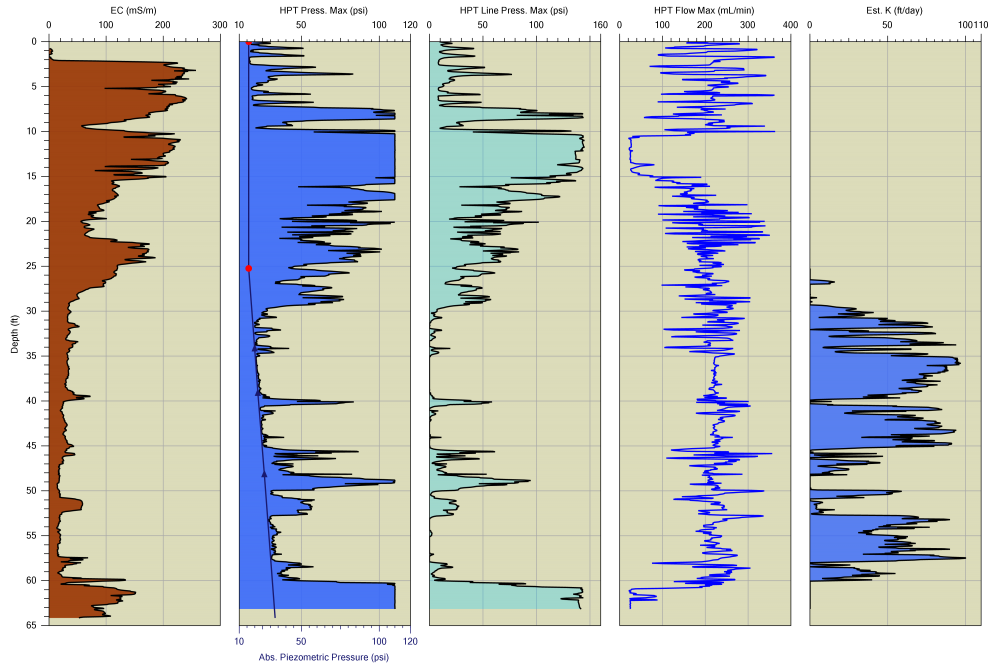
An HPT log includes (from left to right) an EC, HPT Injection Pressure (top axis) with Absolute Piezometric Pressure (bottom axis), HPT Line Pressure, HPT Flow Rate and Estimated Hydraulic Conductivity (K). Comparing EC and HPT pressure graphs we can see there is generally finer grained/lower permeable soils in the upper portion of this log and coarser grained soils with higher permeability in the lower portion of the log.
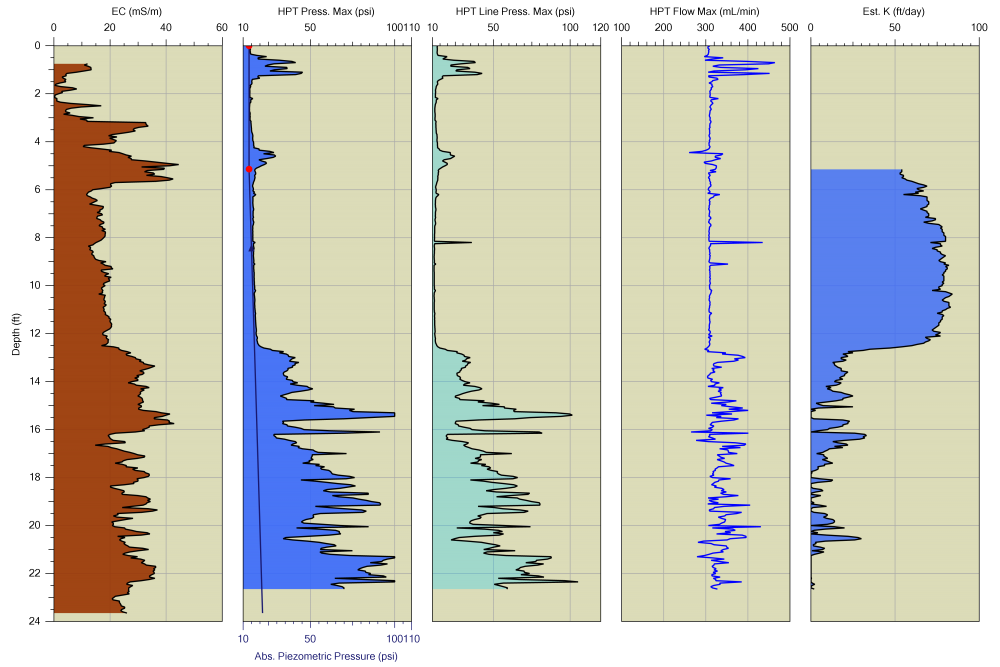
An HPT log includes (from left to right) an EC, HPT Injection Pressure (top axis) with Absolute Piezometric Pressure (bottom axis), HPT Line Pressure, HPT Flow Rate and Estimated Hydraulic Conductivity (K). Comparing EC and HPT pressure graphs we can see there is generally coarser grained/higher permeable soils in the upper portion of this log and finer grained soils with lower permeability in the lower portion of the log.
EC and HPT graphs typically respond in a similar fashion – sands and gravels have lower conductivity and are highly permeability resulting in low HPT injection pressure. As soil particle size decreases, EC results will typically increase as will HPT injection pressure because of the lower permeability of these soils.
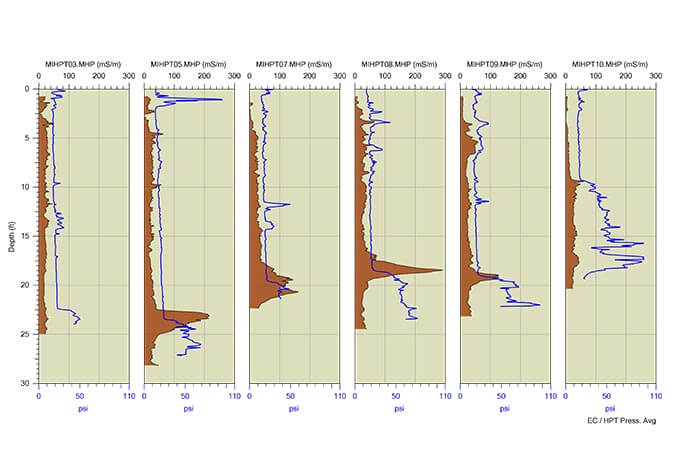
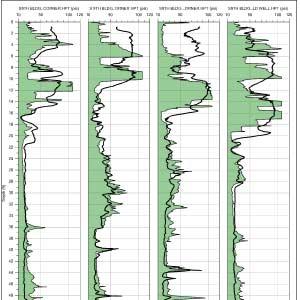
When these sensors do not respond in the same manner there is typically a reason for this. The log below is a site cross section of HPT logs displaying EC and HPT pressure of each log overlaid. In this cross section view, the first log shows EC is not responding well to the transition from sand to the silty-clay formation seen at around 22 feet. This is likely due to the mineral makeup of the soil, however on the inner four logs EC displays a significant rise just before the HPT pressure increase and then a fall when HPT pressure is still high. This is a classic display of an ionic plume which was the result of ionic remediation fluids injected upgradient of these logs.
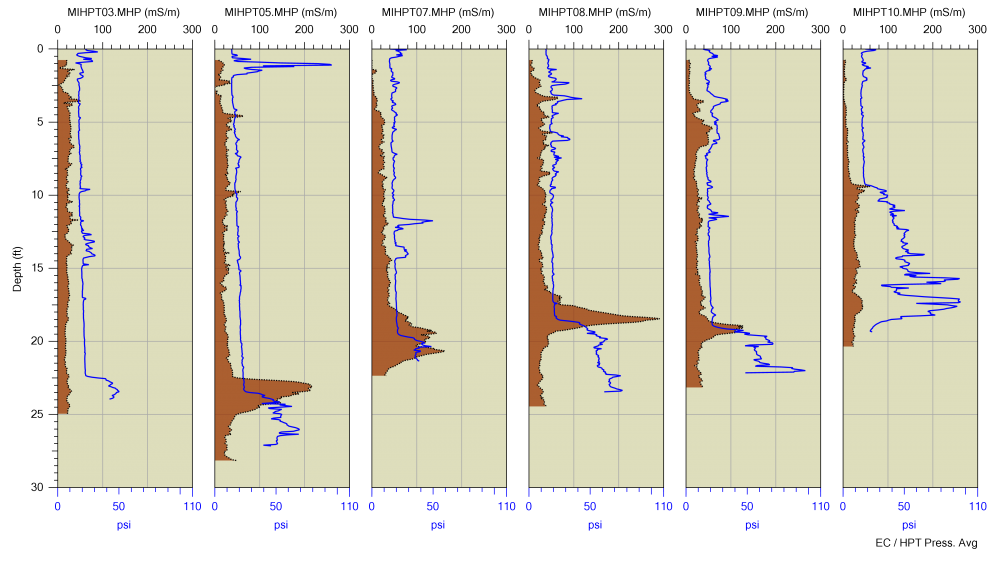
An HPT log cross section from a site showing EC (brown fill) and HPT pressure (blue line - secondary axis).
Site Data
Iron River, Wisconsin
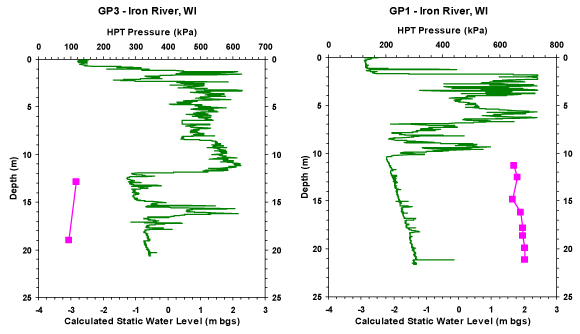
This site consists of silts and clays to about 10.7 to 12.2 m, which is underlain by sands and gravels. A clay layer is located between 15 and 18 m at location GP3. During each push the HPT probe was stopped at each location noted on the logs below. There, the water was tunrned off and pressure was allowed to dissipate. Static water levels were recorded approximately every meter in the sand and gravel layer, and calculations showed that the water level at GP1 was about 1.8 m below ground surface. However, static water levels recorded at location GP3 showed that the piezometric level was approximately 2.9 m above ground surface, indicating artesian conditions. Artesian flow was confirmed by installing casing in the sands and extending it to approximately 2.9 m above ground surface.
Iron River, Wisconsin
Frequently Asked Questions
- Water is spraying out of my HPT screen when I pull it out of the ground. Do I need to replace the screen? If this happens how do I get a good post log reference test?
Probably don’t need to replace. Often brushing across the HPT screen with a stiff wire brush will dislodge fines from the screen and return flow to its normal “trickle” out of the screen. If brushing does not work remove the screen with the MIP/HPT wrench (MN 212094) flush out the HPT port behind the screen with water. Then scrape away any mud behind the screen with a small brush, pick or small screw driver. Then back flush the screen with water to open up the mesh. Once the normal “trickle” flow is restored you will get a good post log reference test for pressure.
- The electrical conductivity (EC) array passed the pre-log QA test but is not passing the post-log QA test. What should I do?
Did you get all soil and mud cleaned off of the 4-electrode array? Are the “spring” contacts on the test jig making contact with all 4 electrodes and body of the probe? Pull on the springs on the test jig in case they got compressed when tossed back in the truck. Is the test jig lined up correctly? (does the jig cable point up the rods? Is the bottom spring contact on the bottom EC electrode?)
- Why should I run a pressure dissipation test during my HPT log?
The pressure dissipation test allows you to correct the “Total” HPT pressure observed by the downhole pressure sensor during the log. This will make it possible for you to determine the local water level in the formation, determine relative formation permeability down the entire log and estimate the hydraulic conductivity (Est K) for the saturated formation.
- Where should I run a pressure dissipation test?
It is best to run a pressure dissipation test in a saturated coarse grained/sandy/permeable zone in the formation. In these materials a pressure dissipation test will often be complete in 2 to 3 minutes. “Complete” means the pressure observed by the HPT pressure sensor is stable and equal to the piezometric pressure in the formation around the HPT screen.
- Do I have to have a pressure “dissipation” test to calculate Estimated hydraulic conductivity (Est K) values for an HPT log?
Getting a fully dissipated test during a log is definitely the best way to get Est K values. But there are other options:
- Get a water level from a nearby well and Enter that data in the “Edit Static Pressures” option in the pop-up menu in the DI Viewer software.
- Install a DP SP16 or SP22 groundwater sampler adjacent to the log location and get a static water level from the developed screen after the water level stabilizes. (this can take a little time!)
- Can I get a fully dissipated “pressure dissipation” test for every HPT log I run?
Probably not. At some sites, the formation logged may be all be low permeability/high HPT pressure (50psi/350+kPa) material. Under these conditions it would take several hours or days for the excess pressure to fully dissipate to the ambient piezometric pressure. Look for any sandy zones below the water table to target for a dissipation test.
- Can I detect contaminants with HPT logs?
Only ionic contaminants, such as salt water or brines. These are detected with the electrical conductivity function of the HPT tool. In zones of very high permeability (coarse grained sandy-gravel units) an estimated of groundwater specific conductance can be displayed in the Direct Image® Viewer software. This would be observed by increasing EC and HPT pressure that does not follow that increase.
Features & Options
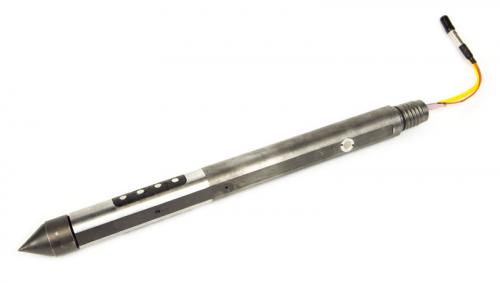
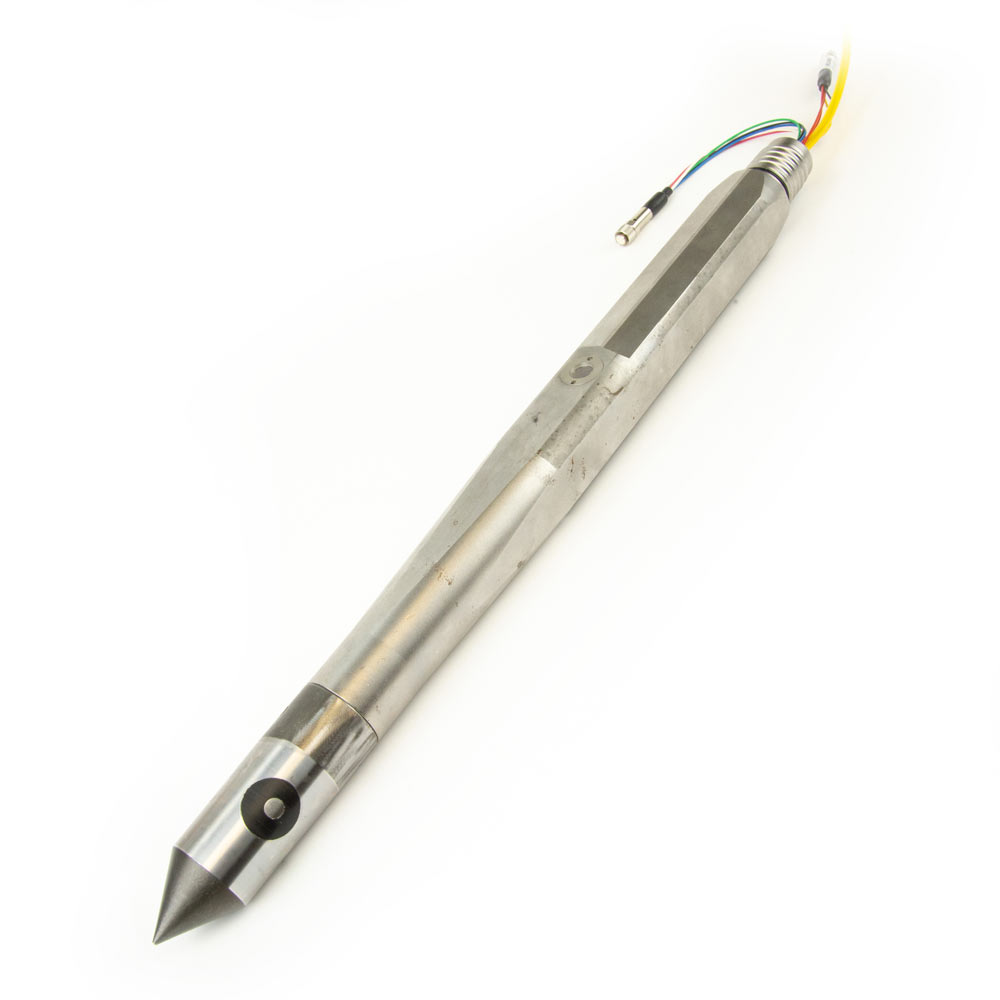
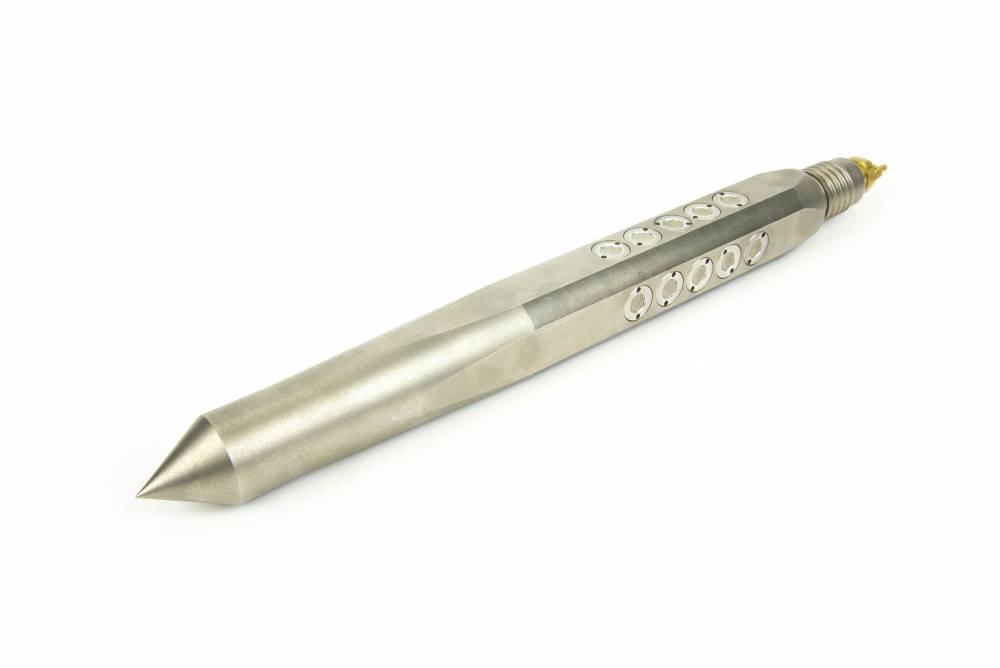
HPT Probe
What is Geoprobe® Direct Image® HPT?
- HPT produces a detailed log of relative formation permeability
- Can be used to estimate hydraulic conductivity in the saturated zone
- Logs HPT injection pressure, flow rate and electrical conductivity
- Use pressure dissipation tests to measure hydrostatic pressure
- Determine piezometric profile and water table depth
- Can be used estimate groundwater specific conductance to map brine contaminant plumes
- HPT logging is easy to learn and operate
- Interpretation of HPT logs is straight forward and intuitive
The Hydraulic Profiling Tool is a logging tool that measures the pressure required to inject a set flow of water into the soil as the probe is advanced into the subsurface. This injection pressure log is an excellent indicator of formation permeability. In addition to measurement of injection pressure, the HPT can also be used to measure hydrostatic pressure under the zero flow condition. This allows the development of an absolute piezometric pressure profile for the log and prediction of the position of the water table. The piezometric profile can be used to calculate the corrected HPT pressure. This data along with the flow rate can then be used to calculate an estimate of hydraulic conductivity (K) in the saturated formation. The injection pressure along with electrical conductivity can be used to estimate groundwater specific conductance where the formation allows.
Video: Hydraulic Profiling Tool (HPT) Overview
Typical HPT Log:
Graphs (left to right) electrical conductivity (EC), HPT injection pressure (top axis/blue fill) with the absolute piezometric pressure profile plotted (bottom axis/black line) and HPT flow rate. The bottom three triangles on the absolute piezometric pressure line represent hydrostatic pressure measurement points. The inflection point (red dot) in the absolute piezometric pressure line is the predicted water table.
A general equipment setup is displayed below. Water from a supply tank (A) is pumped by the HPT controller (B) at a set flow rate through the trunkline (D) and into the formation after passing through the injection screen (F). Measurement of the injection pressure in the HPT system is made using a downhole pressure transducer (E). Use of a transducer in the downhole position allows measurement of the injection pressure at the HPT screen only and excludes frictional losses through the flow tube of the HPT trunkline. The downhole transducer position is also necessary for making hydrostatic pressure measurements at the probe.
Schematic of primary HPT components and operation
HPT logs can provide a clear understanding of the subsurface lithology by combining soil electrical conductivity (EC) with HPT injection pressure. With the EC a small voltage is past between dipoles on the probe moving through the soil and pore fluids. Depending upon the soil mineralogy and pore fluid conductance a relative electrical conductivity is measured. HPT measures the pressure required to inject a set flow of water into the formation which is independent of the subsurface chemistry.
The logs below include (from left to right) an EC, HPT injection pressure (top axis) with absolute piezometric pressure (bottom axis), HPT line pressure, HPT flow rate and estimated hydraulic conductivity (K). The absolute piezometric pressure and estimated hydraulic conductivity graphs are calculated parameters typically performed after the logs is complete. These graphs use dissipation test information (dissipation of HPT Injection pressure leaving atmospheric and hydrostatic pressure) in their calculations for determining the static water level and K. The rest of the graphs are measured in-situ during tool advancement.
An HPT log includes (from left to right) an EC, HPT Injection Pressure (top axis) with Absolute Piezometric Pressure (bottom axis), HPT Line Pressure, HPT Flow Rate and Estimated Hydraulic Conductivity (K). Comparing EC and HPT pressure graphs we can see there is generally finer grained/lower permeable soils in the upper portion of this log and coarser grained soils with higher permeability in the lower portion of the log.
An HPT log includes (from left to right) an EC, HPT Injection Pressure (top axis) with Absolute Piezometric Pressure (bottom axis), HPT Line Pressure, HPT Flow Rate and Estimated Hydraulic Conductivity (K). Comparing EC and HPT pressure graphs we can see there is generally coarser grained/higher permeable soils in the upper portion of this log and finer grained soils with lower permeability in the lower portion of the log.
EC and HPT graphs typically respond in a similar fashion – sands and gravels have lower conductivity and are highly permeability resulting in low HPT injection pressure. As soil particle size decreases, EC results will typically increase as will HPT injection pressure because of the lower permeability of these soils.
When these sensors do not respond in the same manner there is typically a reason for this. The log below is a site cross section of HPT logs displaying EC and HPT pressure of each log overlaid. In this cross section view, the first log shows EC is not responding well to the transition from sand to the silty-clay formation seen at around 22 feet. This is likely due to the mineral makeup of the soil, however on the inner four logs EC displays a significant rise just before the HPT pressure increase and then a fall when HPT pressure is still high. This is a classic display of an ionic plume which was the result of ionic remediation fluids injected upgradient of these logs.
An HPT log cross section from a site showing EC (brown fill) and HPT pressure (blue line - secondary axis).
Iron River, Wisconsin
This site consists of silts and clays to about 10.7 to 12.2 m, which is underlain by sands and gravels. A clay layer is located between 15 and 18 m at location GP3. During each push the HPT probe was stopped at each location noted on the logs below. There, the water was tunrned off and pressure was allowed to dissipate. Static water levels were recorded approximately every meter in the sand and gravel layer, and calculations showed that the water level at GP1 was about 1.8 m below ground surface. However, static water levels recorded at location GP3 showed that the piezometric level was approximately 2.9 m above ground surface, indicating artesian conditions. Artesian flow was confirmed by installing casing in the sands and extending it to approximately 2.9 m above ground surface.
Iron River, Wisconsin
- Water is spraying out of my HPT screen when I pull it out of the ground. Do I need to replace the screen? If this happens how do I get a good post log reference test?
Probably don’t need to replace. Often brushing across the HPT screen with a stiff wire brush will dislodge fines from the screen and return flow to its normal “trickle” out of the screen. If brushing does not work remove the screen with the MIP/HPT wrench (MN 212094) flush out the HPT port behind the screen with water. Then scrape away any mud behind the screen with a small brush, pick or small screw driver. Then back flush the screen with water to open up the mesh. Once the normal “trickle” flow is restored you will get a good post log reference test for pressure.
- The electrical conductivity (EC) array passed the pre-log QA test but is not passing the post-log QA test. What should I do?
Did you get all soil and mud cleaned off of the 4-electrode array? Are the “spring” contacts on the test jig making contact with all 4 electrodes and body of the probe? Pull on the springs on the test jig in case they got compressed when tossed back in the truck. Is the test jig lined up correctly? (does the jig cable point up the rods? Is the bottom spring contact on the bottom EC electrode?)
- Why should I run a pressure dissipation test during my HPT log?
The pressure dissipation test allows you to correct the “Total” HPT pressure observed by the downhole pressure sensor during the log. This will make it possible for you to determine the local water level in the formation, determine relative formation permeability down the entire log and estimate the hydraulic conductivity (Est K) for the saturated formation.
- Where should I run a pressure dissipation test?
It is best to run a pressure dissipation test in a saturated coarse grained/sandy/permeable zone in the formation. In these materials a pressure dissipation test will often be complete in 2 to 3 minutes. “Complete” means the pressure observed by the HPT pressure sensor is stable and equal to the piezometric pressure in the formation around the HPT screen.
- Do I have to have a pressure “dissipation” test to calculate Estimated hydraulic conductivity (Est K) values for an HPT log?
Getting a fully dissipated test during a log is definitely the best way to get Est K values. But there are other options:
- Get a water level from a nearby well and Enter that data in the “Edit Static Pressures” option in the pop-up menu in the DI Viewer software.
- Install a DP SP16 or SP22 groundwater sampler adjacent to the log location and get a static water level from the developed screen after the water level stabilizes. (this can take a little time!)
- Can I get a fully dissipated “pressure dissipation” test for every HPT log I run?
Probably not. At some sites, the formation logged may be all be low permeability/high HPT pressure (50psi/350+kPa) material. Under these conditions it would take several hours or days for the excess pressure to fully dissipate to the ambient piezometric pressure. Look for any sandy zones below the water table to target for a dissipation test.
- Can I detect contaminants with HPT logs?
Only ionic contaminants, such as salt water or brines. These are detected with the electrical conductivity function of the HPT tool. In zones of very high permeability (coarse grained sandy-gravel units) an estimated of groundwater specific conductance can be displayed in the Direct Image® Viewer software. This would be observed by increasing EC and HPT pressure that does not follow that increase.
Tooling & Instrumentation
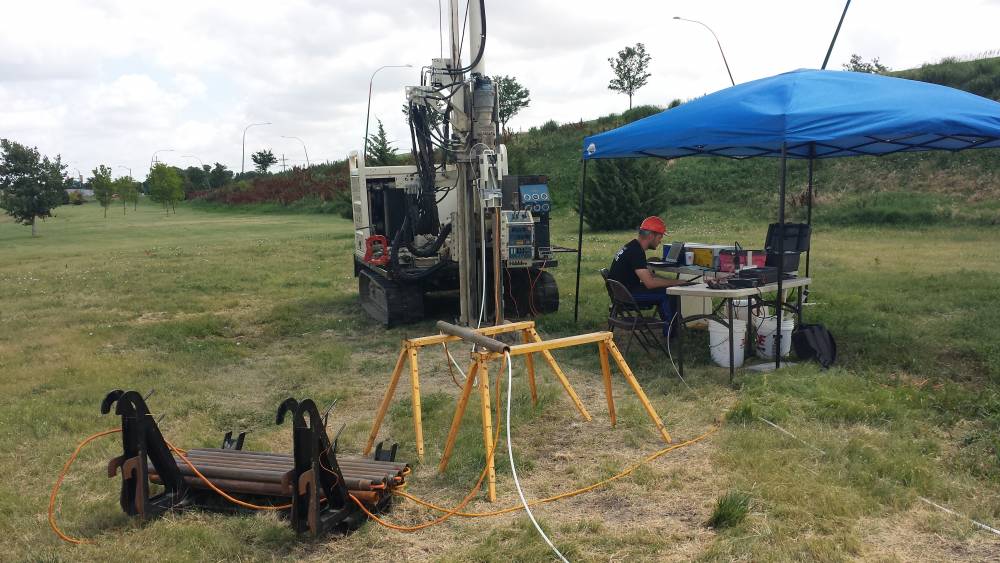
Geoprobe Systems® manufactures all of the equipment needed for HPT logging. This equipment can be divided into two basic categories: surface instrumentation (HPT controller and data acquisition), and downhole probes (including probes, trunklines, connectors, etc.).
The HPT instruments are shown as described below.
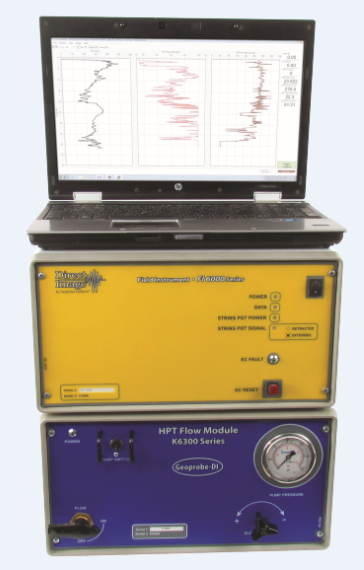
- FI6000: Data acquisition instrument, acquires data from the MIP system’s detectors and sensors and relays it to the computer via a USB connection. The FI6000 is the general data acquisition instrument used in all Geoprobe® DI logging systems (EC and HPT). It also provides the electrical conductivity measurement system associated with MIP.
- K6300 Series HPT Controller: This instrument regulates the water injection flow and measures the injection pressure to the HPT trunkline and probe. Data from this controller is sent to the FI6000 via a data cable.
:
HPT Instrumentation
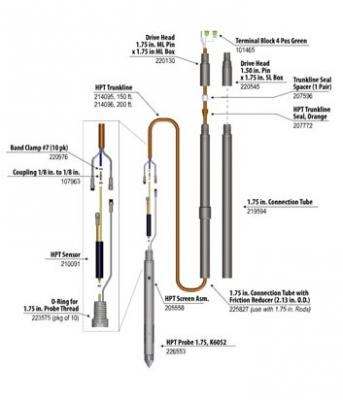
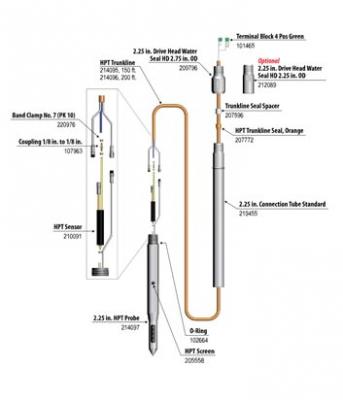
Basic downhole HPT equipment is shown below. There are many variations and combinations of this tooling, depending on the size of the rod string being driven into the ground and the lithology or contaminate sensors that are to be used in combination with the HPT. The standard, most commonly deployed components are shown below:
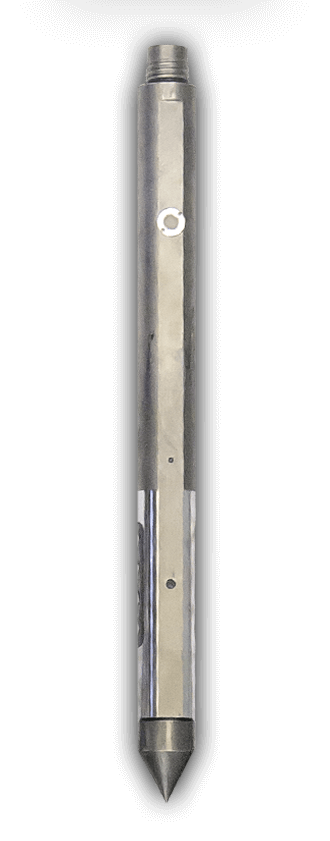
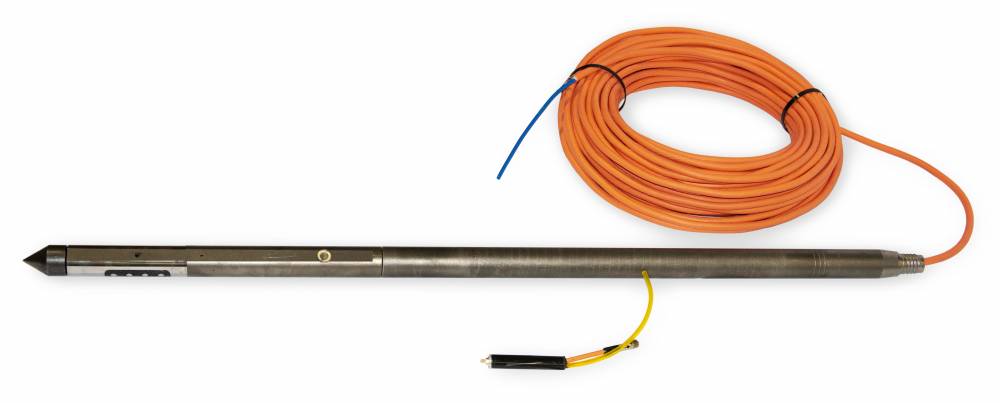
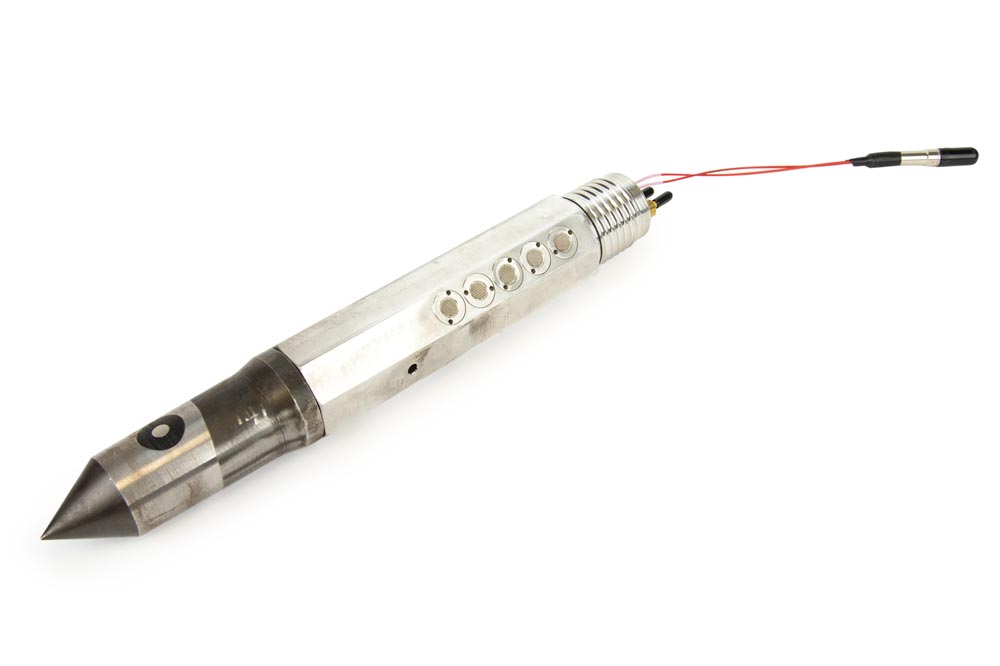
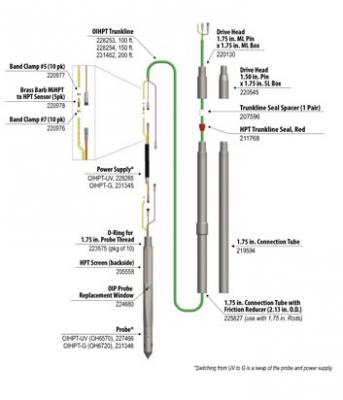
- K6052 HPT probe (MN226553): Removable HPT injection screen and Wenner electrical conductivity array.
- HPT Injection Pressure Sensor (MN 210091).
- HPT Trunkline (MN 214095): 150 ft. (46m) This has electrical wires and Water injection line.
- Connection section and drive head. HPT sensor, water line and electrical connections are carried in this section.
- Probe rods. Geoprobe® 1.75-inch (44mm) and 1.5-inch (38mm) rods are the most commonly used for HPT logging. Successive sections of these rods are added to push or percussion drive the probe to depth.
:
HPT Probe, Pressure Sensor (ran inside the connection tube), connection tube and drive head which connect the drive rods. The HPT trunkline connects the down-hole probe to the up-hole instruments.
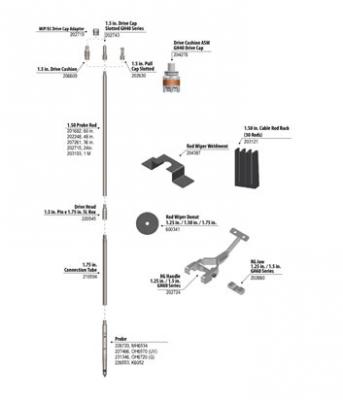
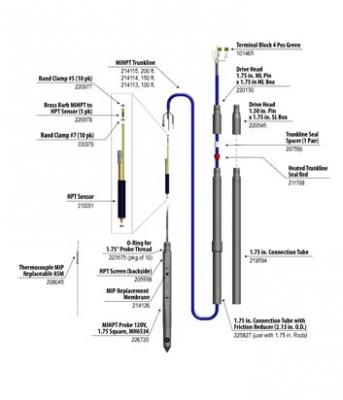
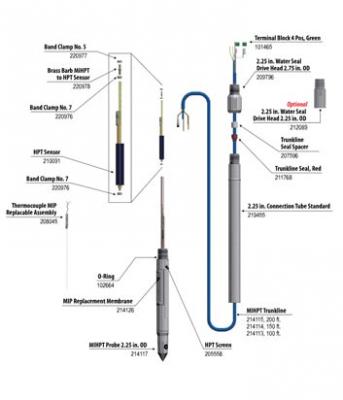
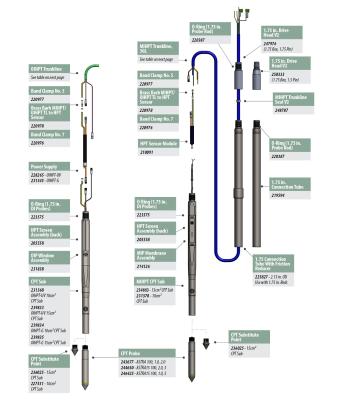
HPT is combined with MIP in the MIHPT logging tool to provide mapping of hydrocarbon and chlorinated VOCs contaminantes while providing context of soil lithology and permeability to understand migration pathways.
> Learn More: MIP
:
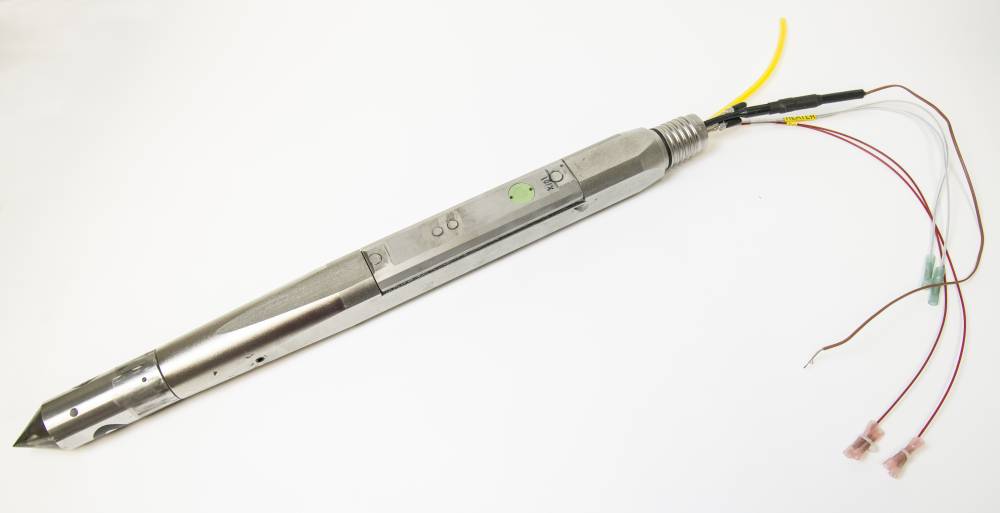
MIHPT Probe
MIHPT Log:
Graphs (Left to Right): EC, HPT Pressure (axis one) Absolute Piezometric Pressure (axis two), Detectors: PID, FID, XSD and Estimated K
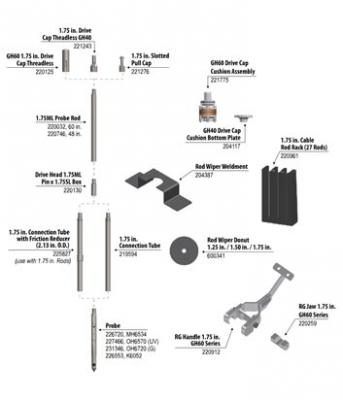
HPT is combined with OIP-UV (MN 227466) in this logging tool to provide logging of hydrocarbon NAPL Fuels and Oil. HPT is combined with OIP-G (MN 231346) for logging of creosote and coal tars. These tools log NAPL level hydrocarbon contaminants while providing context of soil lithology and permeability to understand migration pathways.
> Learn More: OIP
:
OIHPT Probe (UV or G)
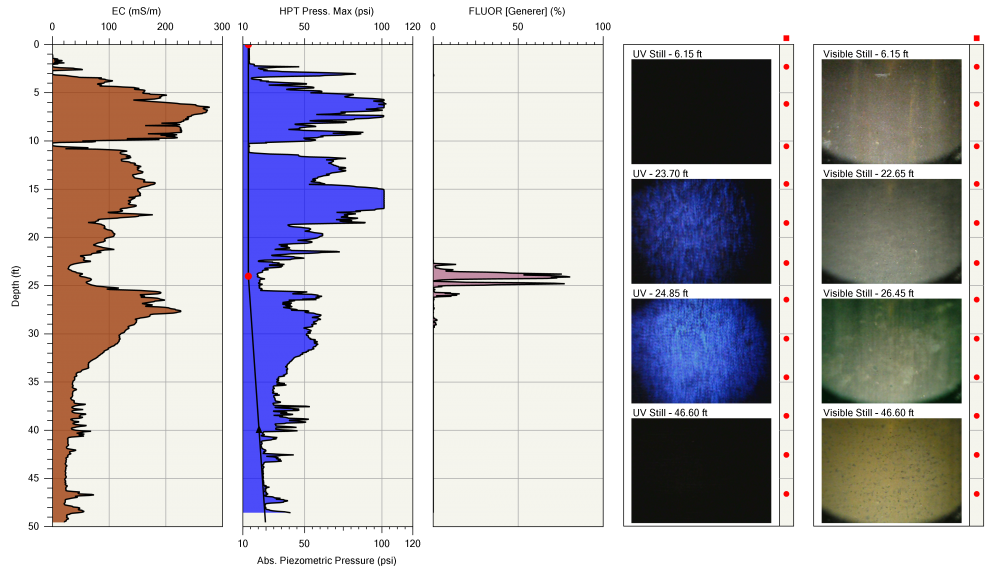
OIHPT Log:
Graphs (Left to Right): EC, HPT Pressure (axis one) Absolute Piezometric Pressure (axis two), Fluorescence % area, displayed fluorescence and visible images from various depths in the log.
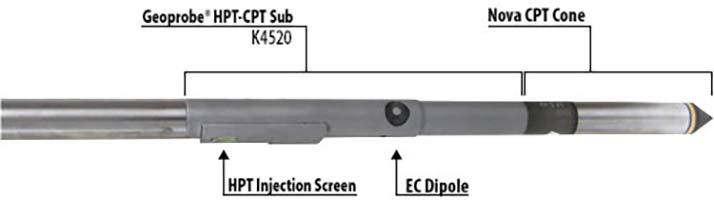
The HPT has been used as a surrogate for U(2) pore pressure measurements, especially in unsaturated zones. The HPT is also a dependable indicator of seepage zones from dams and levees. The HPT sub for CPT usage includes the EC dipole, HPT pressure sensor and injection port.
> Learn More: CPT
:
HPT sub for use with CPT Cone
The KS8050 (MN 216100) 2.25in. (57.2mm) HPT groundwater sampling probe can be advanced to generate an HPT-EC log and stop along the way to collect groundwater samples where desired. This can be done at mulitple locations in a log. The KS8052 operates using a standard HPT trunkline along with a 1/4in. OD water sample line strung up in 2.25in. probe rods. When groundwater samples are desired the operator will stop and perform a dissipation test and then begin sampling through the return water line which may include use of a mechanical bladder pump or peristalitic pump if the water table is shallow enough. When the sample has been collected the operator will restart the HPT water injection and resume logging.
:
HPT-Groundwater Sampler
:
HPT GWS Sampling Setup
The GW Profiler allows you to create an injection pressure log and be able to stop and sample groundwater at specific intervals. This sampler operates with 1.75in. probe rods and uses two 1/4in. water lines one as an injection line and one as a sample line. Currently this tool does not operate with a downhole HPT sensor or an EC dipole.
:
GW Profiler 1.75 Probe
Videos
ID: 1960
ID: 1954
ID: 1965
ID: 1961
Resources
Click on a section below to view information.


Direct Image® Tooling provides high-quality data in the unforgiving geology of Alaska.
ID: 14360 | Date:

Leaning on the can-do lessons of his Marine training and the small-company culture he cherished during his first drilling job guides building Veteran Drilling into high resolution site characterization resource for California.
ID: 5775 | Date:
Geoprobe® HPT is becoming one of the most common direct push logging tools used in site characterization. An HPT port is now included on ALL MIP...
ID: 5325 | Date:
Since the release of the Hydraulic Profiling Tool (HPT) in 2006...
ID: 5230 | Date:
Hydraulic Profiling Tool (HPT) Logging is getting a lot of use these days. HPT logs are a good tool for evaluating site stratigraphy...
ID: 5182 | Date:


| Specs | |
|---|---|
| Data Acquisition Rate | 5 Hz |
| Recommended Probing Rate | 2 cm/sec |
| Conductivity Array | Wenner |
| Working Depth (max) | 120 ft (36.6 m) below groundwater |
| Pressure Transducer | |
|---|---|
| Operating Pressure | 0-101 psia |
| Maximum Overpressure | 400 psia |
| Full Scale Accuracy | 2.5 percent |
| Flow Meter | |
|---|---|
| Flow Rate (max) | 0-1 Lpm |
| Pressure (max) | 500 psig |
| Full Scale Accuracy | +/- 1 percent |
| Full Scale Repeatability | +/- 0.2 percent |
| Flow Controller | |
|---|---|
| Maximum Flow Rate | 0-1 Lpm |
| Maximum Pressure | 500 psig |
| Stability of Setpoint | 2 percent +/- 0.5 percent |
| Repeatability | 0.3 percent |
Depend on Team Geoprobe®
Since 1987, Geoprobe® has manufactured innovative drilling rigs and tooling - engineered for efficiency and safety - simplifying drillers’ jobs and empowering their companies to succeed as productive and profitable leaders in the industry. When you partner with Geoprobe® you receive:
Customer-inspired Innovation
Engineering and building industry-leading drilling rigs, tooling, and techniques for the technical driller based on your needs to work safer and more efficiently.
Exceptional Value
Ensuring drilling rigs and tooling are created in conjunction – with consistent quality – to collect the highest-quality information with the most accurate result to get you to, into, and through the job efficiently.
Superior Service
Equipping you to do your best job and keeping you in the field via one-on-one expert sales and service technicians manning live support phone lines, shipping necessary parts same-day.
What is Geoprobe® Direct Image® HPT?
- HPT produces a detailed log of relative formation permeability
- Can be used to estimate hydraulic conductivity in the saturated zone
- Logs HPT injection pressure, flow rate and electrical conductivity
- Use pressure dissipation tests to measure hydrostatic pressure
- Determine piezometric profile and water table depth
- Can be used estimate groundwater specific conductance to map brine contaminant plumes
- HPT logging is easy to learn and operate
- Interpretation of HPT logs is straight forward and intuitive
The Hydraulic Profiling Tool is a logging tool that measures the pressure required to inject a set flow of water into the soil as the probe is advanced into the subsurface. This injection pressure log is an excellent indicator of formation permeability. In addition to measurement of injection pressure, the HPT can also be used to measure hydrostatic pressure under the zero flow condition. This allows the development of an absolute piezometric pressure profile for the log and prediction of the position of the water table. The piezometric profile can be used to calculate the corrected HPT pressure. This data along with the flow rate can then be used to calculate an estimate of hydraulic conductivity (K) in the saturated formation. The injection pressure along with electrical conductivity can be used to estimate groundwater specific conductance where the formation allows.
Typical HPT Log: Graphs (left to right) electrical conductivity (EC), HPT injection pressure (top axis/blue fill) with the absolute piezometric pressure profile plotted (bottom axis/black line) and HPT flow rate. The bottom three triangles on the absolute piezometric pressure line represent hydrostatic pressure measurement points. The inflection point (red dot) in the absolute piezometric pressure line is the predicted water table.
:
:
:
A general equipment setup is displayed below. Water from a supply tank (A) is pumped by the HPT controller (B) at a set flow rate through the trunkline (D) and into the formation after passing through the injection screen (F). Measurement of the injection pressure in the HPT system is made using a downhole pressure transducer (E). Use of a transducer in the downhole position allows measurement of the injection pressure at the HPT screen only and excludes frictional losses through the flow tube of the HPT trunkline. The downhole transducer position is also necessary for making hydrostatic pressure measurements at the probe.
: Schematic of primary HPT components and operation
:
:
:
HPT logs can provide a clear understanding of the subsurface lithology by combining soil electrical conductivity (EC) with HPT injection pressure. With the EC a small voltage is past between dipoles on the probe moving through the soil and pore fluids. Depending upon the soil mineralogy and pore fluid conductance a relative electrical conductivity is measured. HPT measures the pressure required to inject a set flow of water into the formation which is independent of the subsurface chemistry.
The logs below include (from left to right) an EC, HPT injection pressure (top axis) with absolute piezometric pressure (bottom axis), HPT line pressure, HPT flow rate and estimated hydraulic conductivity (K). The absolute piezometric pressure and estimated hydraulic conductivity graphs are calculated parameters typically performed after the logs is complete. These graphs use dissipation test information (dissipation of HPT Injection pressure leaving atmospheric and hydrostatic pressure) in their calculations for determining the static water level and K. The rest of the graphs are measured in-situ during tool advancement.
: An HPT log includes (from left to right) an EC, HPT Injection Pressure (top axis) with Absolute Piezometric Pressure (bottom axis), HPT Line Pressure, HPT Flow Rate and Estimated Hydraulic Conductivity (K). Comparing EC and HPT pressure graphs we can see there is generally finer grained/lower permeable soils in the upper portion of this log and coarser grained soils with higher permeability in the lower portion of the log.
: An HPT log includes (from left to right) an EC, HPT Injection Pressure (top axis) with Absolute Piezometric Pressure (bottom axis), HPT Line Pressure, HPT Flow Rate and Estimated Hydraulic Conductivity (K). Comparing EC and HPT pressure graphs we can see there is generally coarser grained/higher permeable soils in the upper portion of this log and finer grained soils with lower permeability in the lower portion of the log.
EC and HPT graphs typically respond in a similar fashion – sands and gravels have lower conductivity and are highly permeability resulting in low HPT injection pressure. As soil particle size decreases, EC results will typically increase as will HPT injection pressure because of the lower permeability of these soils.
When these sensors do not respond in the same manner there is typically a reason for this. The log below is a site cross section of HPT logs displaying EC and HPT pressure of each log overlaid. In this cross section view, the first log shows EC is not responding well to the transition from sand to the silty-clay formation seen at around 22 feet. This is likely due to the mineral makeup of the soil, however on the inner four logs EC displays a significant rise just before the HPT pressure increase and then a fall when HPT pressure is still high. This is a classic display of an ionic plume which was the result of ionic remediation fluids injected upgradient of these logs.
: An HPT log cross section from a site showing EC (brown fill) and HPT pressure (blue line - secondary axis).
:
Iron River, Wisconsin
This site consists of silts and clays to about 10.7 to 12.2 m, which is underlain by sands and gravels. A clay layer is located between 15 and 18 m at location GP3. During each push the HPT probe was stopped at each location noted on the logs below. There, the water was tunrned off and pressure was allowed to dissipate. Static water levels were recorded approximately every meter in the sand and gravel layer, and calculations showed that the water level at GP1 was about 1.8 m below ground surface. However, static water levels recorded at location GP3 showed that the piezometric level was approximately 2.9 m above ground surface, indicating artesian conditions. Artesian flow was confirmed by installing casing in the sands and extending it to approximately 2.9 m above ground surface.
: Iron River, Wisconsin
:
:
: