
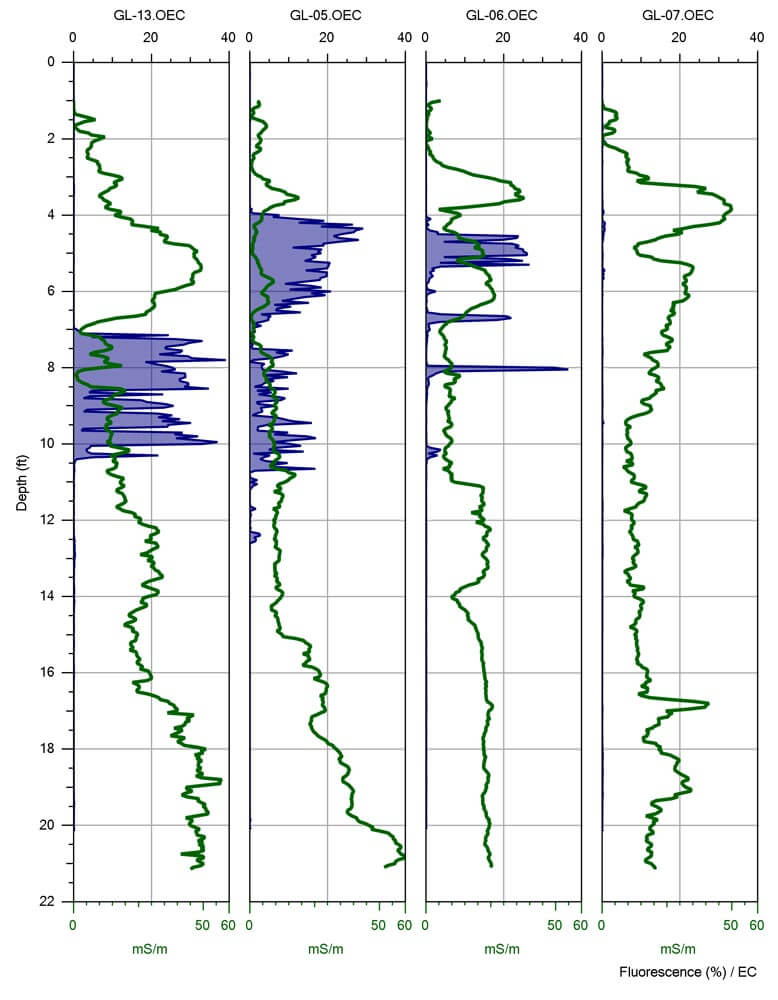
OIP log cross-section from former gas station site. Electrical Condtivity (EC) logs are shown in green. The OIP fluorescence are (%) is shown by the blue shaded area. Cross sections of OIP logs are easily developed using the DI Viewer Software available from Geoprobe Systems®.
The Direct Image® Team at Geoprobe Systems® proudly announces the commercial release of their newest Direct Image® logging tool ... the Optical Image Profiler (OIP). The easy-to-use OIP is capable of capturing soil images using both visible and UV light sources. The logs can then be used to create highly detailed conceptual site models.
To further explain the new technology and how it came about, we asked Tom Christy (TMC), DI Team Leader and Geoprobe® Vice President, some questions. His remarks follow.
Probing Times (PT): Well, the Direct Image® Group here at Geoprobe Systems® is creating a bit of a splash with the release of the OIP tool. Could you give us an explanation of what this OIP tool is?
TMC: Well, it’s pretty simple. OIP stands for “Optical Image Profiler.” We put a small camera inside a probe that takes pictures of soil through a window in the side of the probe. So far so good, right? Then we supplied the camera with two light sources to view soil: a UV light and a visible light. Once you see it and work with the tool, the thing that you appreciate about it is its simplicity. But I can assure you, it was not an easy tool to develop.
PT: What was the difficulty? They make those cameras pretty small these days.
TMC: Fitting a camera to the probe was not too difficult. But making the probe so you can drive on it with a modern direct push machine like the 7822DT ... now that’s a very hard task.
Probing Times: So, how did you do it?
TMC: I’m not telling … exactly! Some things will be obvious to field users. We separated quite a bit of the system electronics into the connection section above the probe, much like we do with HPT. That’s one part of the solution. The rest of it, the part in the probe itself, took some invention.
Probing Times: Did this product turn out like you had originally envisioned?
TMC: Not really. Troy Schmidt and I started bouncing ideas around on this tool years ago. Our first concept was for a visible image profiler. What surprised us were the amazing results from our feasibility studies using our probe camera as a fuel fluorescence detector. That early testing was so compelling that we pursued fluorescence as our primary objective for the tool.
Probing Times: What did you find so compelling?
TMC: The fact that we could see hydrocarbon fluorescence in real time. Sure, we can analyze those images to give a detection factor and make a log of that. But you can see it with your ‘own eyes in the ground’. And you can save all those images and review them to QC the log. It’s hard to argue with actual soil images.
Contact Us
1835 Wall Street
Salina, Kansas 67401
Phone: (785) 825-1842
Photo Gallery

OIP log cross-section from former gas station site. Electrical Condtivity (EC) logs are shown in green. The OIP fluorescence are (%) is shown by the blue shaded area. Cross sections of OIP logs are easily developed using the DI Viewer Software available from Geoprobe Systems®.
The Orange Man Group, also know as the design team for the new Optical Image Profiler: (l to r) Tom Christy, Dan Pipp, Troy Schmidt, Greg Shipley, Steven Colgrove, Ben Jaster and Blake Slater. And actually everyone in the DI group was involved at some point!
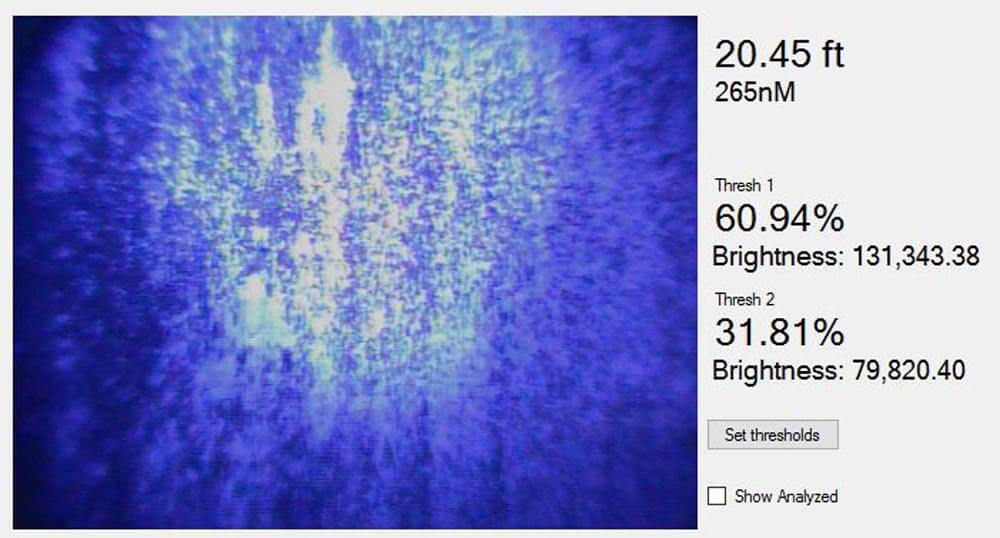
A UV fluorescence image from 20.45 feet (6.23 m) depth on the log. Image analysis indicates that over 90 percent of this image exhibits fuel fluorescence.
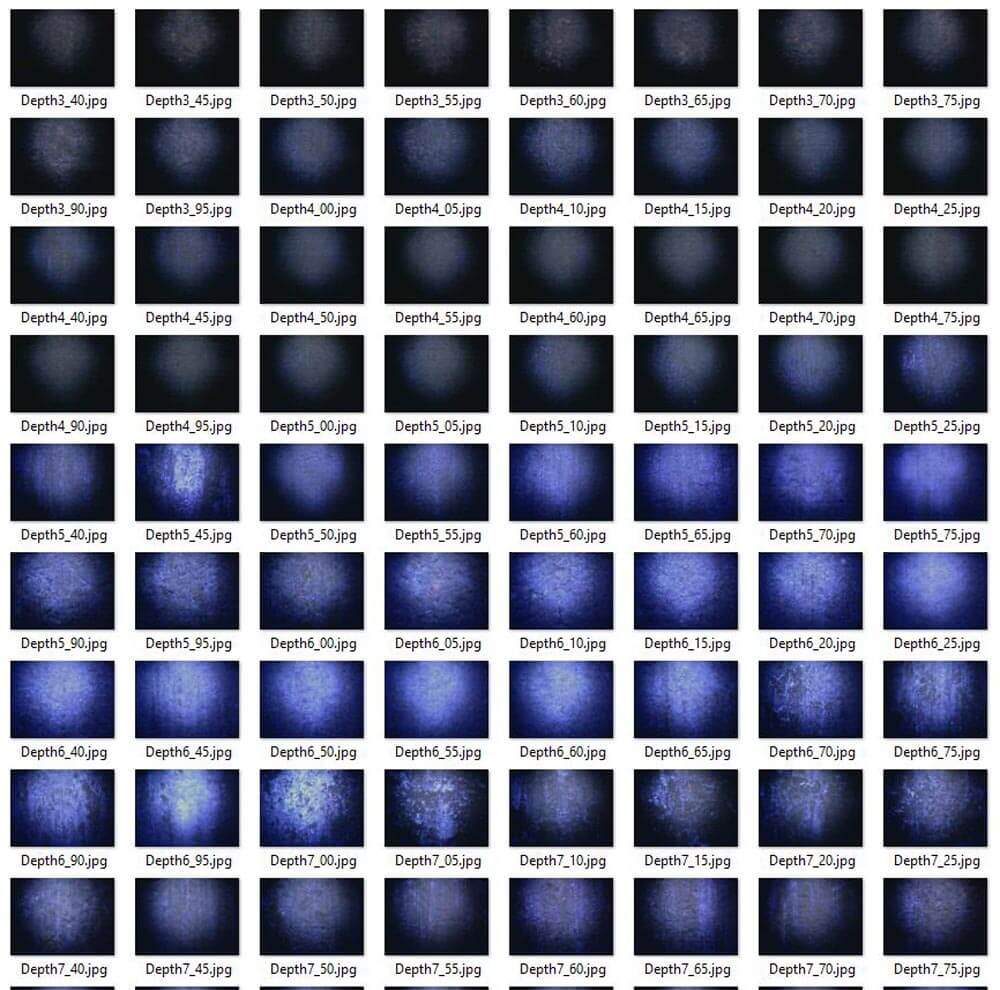
A sample of file images from an OIP log. Fuel fluorescence can be readily observed in many of these images. OIP image analysis calculates a fluorescence area of each image for the OIP log.
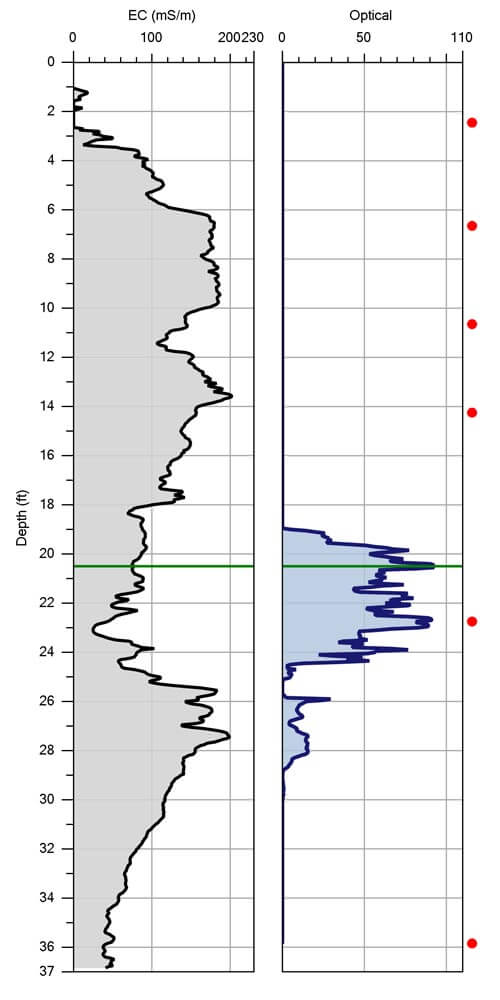
Typical OIP log. The soil Electrical Conductivity is shown on the left. The OIP log of Fluorescence (% of Image Area) is shown on the right. In this case, the OIP log indicates the presence of NAPL from approximately 19 to 29 ft. (5.7 to 8.8 m).
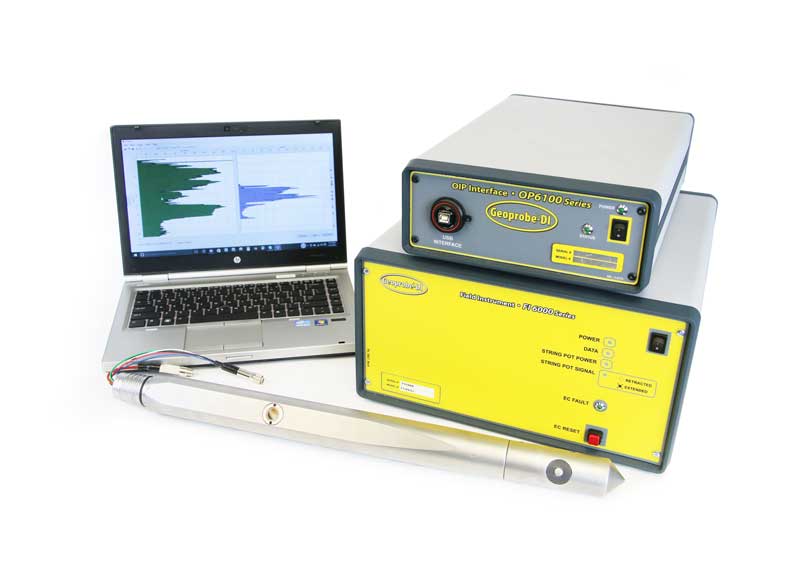
OIP System Major Components: (top, clockwise) Laptop Computer, Field Instrument (FI6000), Optical Interface Probe (OP6560), Optical Interface (OP6100).
Related Videos
ID: 14050
ID: 6608
ID: 1997
ID: 1996
ID: 1994
ID: 1995
ID: 1979
ID: 1965
ID: 279