
Video Summary:
This video takes a look at the Membrane Interface Probe from Geoprobe® Direct Image®. It includes sections on MIP overview, components, logging, and results.
Contact Us
1835 Wall Street
Salina, Kansas 67401
Phone: (785) 825-1842
Transcript
The Membrane Interface Probe (or MIP) is a direct push logging technology from Geoprobe® that is used to locate volatile organic compounds in unconsolidated formations. This includes identifying contaminate source zones as well as defining plume extents down to sub parts-per-million levels. In a special low-level configuration, MIP detection limits can drop to levels below 100 parts-per-billion.
MIP is one of the most commonly used real-time high resolution site characterization tool in use today. First introduced in the mid-1990s, the tool has undergone many revisions and is more robust than ever. No other tool can match the ability of MIP to collect high resolution data for both VOC’s and lithology.
The data has been used extensively throughout the world to provide guidance for site remediation. Environmental Professionals and remediation specialists often consider MIP data as essential to guide placement of treatment chemicals, to target sampling zones and to ensure proper monitoring well placement.
The Membrane Interface Probe is named for the semipermeable membrane located on a heated block on the side of the probe. Volatile contaminants encountered in the subsurface diffuse through the membrane into the probe. An inert carrier gas continuously sweeps the area behind the membrane and transports the volatile compounds through the trunkline to surface gas phase detectors.
The MIP is useful for mapping gasoline range petroleum hydrocarbons, halogenated solvents, and natural gas compounds such as methane.
The Geoprobe® MIHPT probe combines the MIP system with two additional sensors - electrical conductivity (or EC) and the Hydraulic Profiling Tool (or HPT).
The electrical conductivity dipole sensor is used for mapping soil and pore fluid electrical conductance. This gives us an understanding of subsurface lithology.
The hydraulic profiling tool uses a down-hole pressure sensor to monitor the pressure required to inject a set flow of water out of the HPT screen. The resulting pressure log is directly related to subsurface permeability. Calculations can be performed on this data to determine static water level, estimates of hydraulic conductivity (K) as well as groundwater specific conductance where the formation allows.
By operating MIP, HPT and EC sensors together, operators and end users can gain valuable information about their site. The ASTM standard for MIP operation is D7352.
The MIP membrane area of the probe is heated to 120 degrees Celsius and this encourages volatilization and diffusion of VOC compounds across the membrane, where they’re brought into a carrier gas and transported to surface detectors. The MIP probe is connected to up-hole instrumentation via a trunkline which is threaded through each of the rods.
The up-hole instrumentation of the MIP system includes the gas chromatograph which houses three gas phase detectors – the photoionization detector, the flame ionization detector, and the halogen specific detector. Each of these three detectors responds to a different physical attribute of the analytes we’re looking to detect. By using all three of these detectors together, the operator can determine a specific compound class compound class of the analytes as well as relative concentrations within the plume.
The MIP controller regulates and monitors the trunkline carrier gas flow rate and pressure as well as maintaining the 120 degree setpoint on the probe. The HPT controller regulates and monitors flow rate and pressure of the water injection for permeability measurements. The field instrument regulates the EC circuit on the probe as well as collecting all the information from the MIP and HPT controllers and passes that information onto the software on the field laptop.
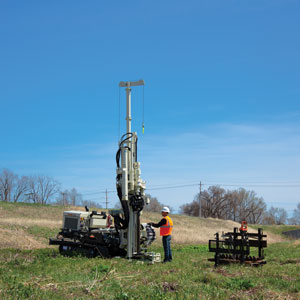
Once the equipment is set up in the field, quality assurance tests of the sensors on the probe are performed before and after each log to validate the equipment is generating accurate data. Depth is recorded by connecting a depth potentiometer to the unit. The log is started once the MIP membrane is even with the ground surface.
Standard advancement of the probe is at a rate of one foot per minute. This is accomplished by advancing the probe 1 ft (30cm) over 15 seconds. The probe is held at that depth for 45 seconds. This is done to increase the subsurface temperature to the 120 degrees Celcius setpoint which enhances contaminant volatilization and diffusion across the membrane. This also encourages membrane cleanup as the probe is advanced through contaminant zones. The process its repeated until the predetermined log depth is reached or until refusal is attained.
This MIHPT log shows EC and HPT Pressure which have similar profiles. The PID and FID begin responding as we transition into a zone of higher permeability at 30 feet. With no XSD response, which is the secondary axis of the PID, this log is of a non-chlorinated species and likely a petroleum hydrocarbon plume.
After the logs are complete, operators can open them in the DI Viewer software to review, print and export the data for modeling. DI Viewer is a free software available on our website for all to use. Here we see an individual log where all sensor data has been saved and can be reviewed.
Multiple logs can easily be pulled into cross a sectional view. Initially we view the EC graph of each log, then we are adding the PID response. We see most of the plume is from 15 to 35 feet on this site. When the graph scales are set to the same levels, the two logs in the middle show the highest responses indicating this is where most of the contaminant mass is located.
Observing logs in cross section is a quick, easy step that provides a tremendous amount of information about the plume location and mobility. The MIHPT data can also be exported and used in other 3D modeling programs.
Once logging is complete, the rod string can then be pulled. The MIHPT results are semi-quantitative and can be confirmed for specific analytes and concentrations by targeted offset soil and/or groundwater sampling.
The Membrane Interface Probe from Geoprobe® is used to locate where VOC contaminants are, determine relative concentration, and the type of soil they are located in. This is why the MIP is very popular for guiding remediation projects. Geoprobe® offers a detailed training program for MIP operators, including field contaminant logging exercises.
For more information, visit our MIP webpage at geoprobe.com/mip or call us at 785-825-1842.