
Microsoft .NET Framework 4.6.1 is required to run this software. To download this, click here.
Note: Microsoft .NET Framework 4.6.1 comes pre-installed on Windows 10
What is Geoprobe® Direct Image® Viewer?
- Automatically opens and displays all types of Geoprobe®-DI Logs including EC, HPT, MIP, MIHPT, OIP and OIHPT.
- Used by field operators to QC finish logs in the field.
- Used by consultants, regulators, and site owners to compare logs and develop site models.
- Can display multiple logs in either cross section or overlay formats.
- Includes post logging calculation algorithms including estimated hydraulic conductivity (K), piezometric profile, and estimated groundwater specific conductance of HPT logs.
- Allows printing and exporting of log graphics to other applications.
The DI Viewer is a “Display Log” utility program created by Geoprobe Systems® to allow rapid viewing, comparison, printing and export of Geoprobe®-DI logs. Supported log types include EC, HPT, MIP, MIHPT, OIP, OIHPT and CPT. Geoprobe Systems® offers this software as a free download so that consultants, regulators, site owners, and others who specify or use DI log data can rapidly open and review logs supplied by DI service providers.
A typical computer screen display from the DI Viewer is shown in Figure 1 below.
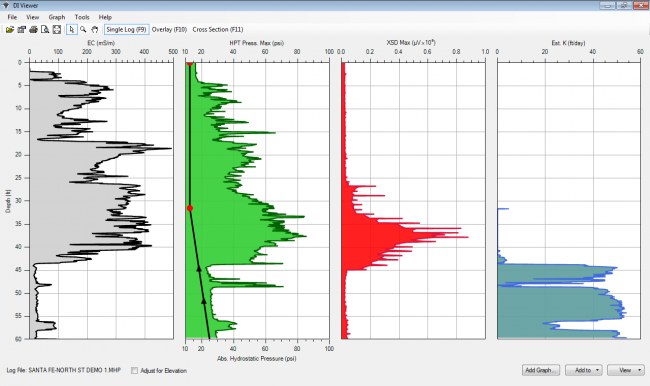
Figure 1: Single log graph of an MIHPT log showing (left to right):
EC, HPT Pressure with Hydrostatic Profile, XSD Detector Response and Estimated K.
System Requirements:
- Windows 11 or later.
- Windows Installer v. 3.1 or later.
- .Net Framework 3.5 (requires at least a 400 MHz processor, 96 MB of RAM, 280 MB of free disk space, and Internet Explorer 5 or later).
The installer will attempt to download any missing components from Microsoft's website if they're not already installed, but if you will be installing this software on a computer without access to the Internet, you can download the .Net Framework 3.5 here and Windows Installer here.
Log Display Options
The DI Viewer has three log display options which allow the user to display and compare data quickly and easily to get the most information possible. The software automatically recognizes which log type has been chosen to display. Appropriate graph series will be displayed for the chosen log type. Options are available to view different graph series.
- Single Log will allow you to view any of the graphs associated with a single log. The software will display graph series specific to the type of log that has been selected. The single log display is the default viewing format when the program is started (Figure 2).
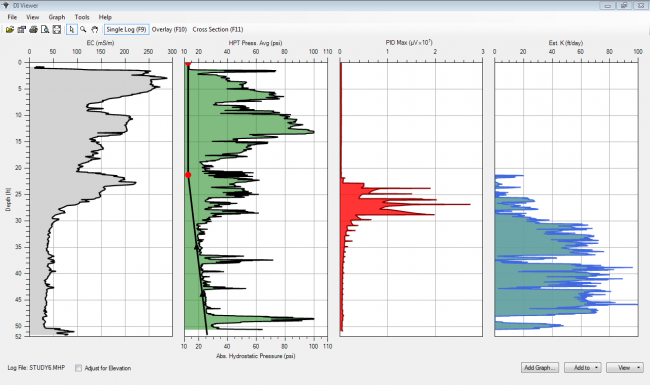
Figure 2: Single log graph of an MIHPT log showing (left to right):
EC, HPT Pressure with Hydrostatic Profile, PID Detector Response and Estimated K. The graphs highlight soil type and permeability, contaminant profile and groundwater flow rates.
- Overlay allows you to compare the graphs between different logs (Figure 3). This is often done with logs performed in close proximity to one another or at the same location before and after a remediation event.
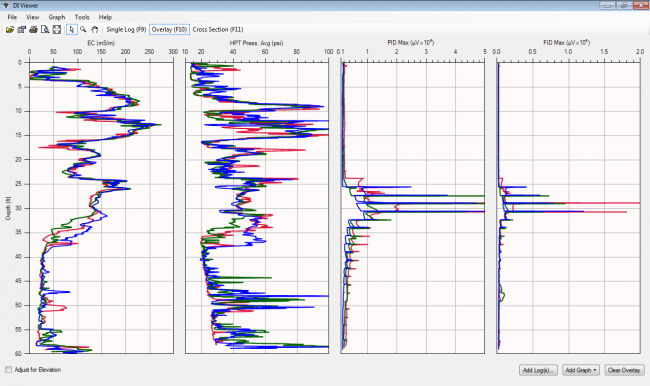
Figure 3: An Overlay of 3 MIHPT logs showing left to right: EC, HPT Injection Pressure, PID and FID Detector Responses. This display allows the user to evaluate the repeatability of logs performed in close proximity or to quickly determine contaminant level changes over time.
- Cross Section allows you to compare up to 2 graphs for multiple logs (Figure 4). This is used to compare a series of logs that have been performed to see how lithology, permeability or contaminant readings change as you move across a site. This tool allows a quick visual for assisting in locating where subsequent logs need to be placed or where confirmation samples need to be collected.
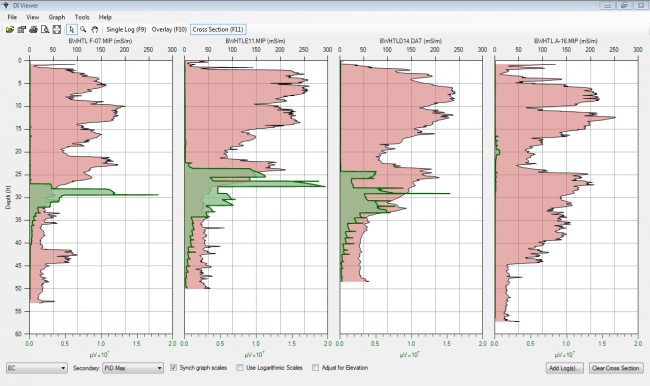
Figure 4: A Cross Section of 4 MIP logs. Electrical conductivity is shown in red while PID detector response is shown in green. Cross sections like this help the user to understand the distribution and mobility of contaminants in the subsurface.
Software Functions Overview
How to Access the Different Log Displays:
- Selecting the display you wish to use from the tool bar.
- Use the quick keys F9 – Single Log, F10 - Overlay or F11 Cross Section.
- Or select View tab above the toolbar and select the log display you wish to use.
Drop-down Menus, Pop-Up Menus and Adjusting Scales:
Many DI Viewer functions can be accessed from drop-down menus at the upper left of the screen. Additional functions are accessed by moving the cursor over any graph and right clicking the mouse. The scales on vertical and horizontal axis can be adjusted by placing the curser over the max or min value, double-clicking the mouse and entering the desired value.
Printing and Exporting Logs:
Logs can be printed as displayed in the printer preview tab to your printer, PDF, or JPG file with the appropriate programs and drivers or you can export your logs to a JPG, BMP or PNG file directly from the software. The exported logs will not contain any site or client information as the printouts do which is useful for creating log images to be used for presentations and in marketing documents.
Click on the user guide below for more details on software features and operation
= Tool String Diagram (TSD)