Video Summary:
This video gives an overview of the HPT system and reviews components, logging, and results.
Contact Us
1835 Wall Street
Salina, Kansas 67401
Phone: (785) 825-1842
Transcript
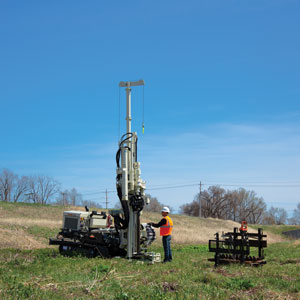
The Hydraulic Profiling Tool from Geoprobe® is a real-time logging tool that measures the pressure required to inject a set flow of water into the soil as the probe is advanced into the subsurface. HPT logs are used to determine the geohydrologic characterization of soils. The logs can indicate hydraulic conductivity, electrical conductivity, hydrostatic profile, and areas of EC and permeability anomalies.
The HPT system is designed to evaluate the hydraulic behavior of unconsolidated materials. As the probe is pushed or hammered into the subsurface, clean water is pumped through a screen on the side of the HPT probe at a low flow rate. Injection pressure, which is monitored and plotted with depth, is an indication of the hydraulic properties of the soil. That is, a low-pressure response would indicate a relatively large grain size, and higher permeability. Conversely, a high HPT pressure response would indicate a relatively small grain size and the lower soil permeability.
An electrical conductivity measurement array is built into the HPT probe. This allows the user to collect soil electrical conductivity (EC) data for lithologic interpretation. In general, the higher the electrical conductivity value, the smaller the grain size, and vice versa. Minerology of the soil is the primary factor that influences soil EC response, however, other factors will influence subsurface conductance, such as pore water chemistry (brines, extreme pH, ionic contaminants). In contrast, HPT is a physical pressure response and is independent of these chemical influences.
HPT pressure is combination of atmospheric, hydrostatic, and injection pressure.
The HPT system may be used to direct other investigation methods, such as soil and groundwater sampling and slug testing. HPT pressure response and EC data can help target zones of geologic and hydraulic interest, identify contaminant migration transport and storage zones as well as minimize the number of soil and groundwater samples required to adequately develop a conceptual site model. When hydraulic conductivity values are required, the HPT system can also help the user identify zones to slug test, as well as the length of the screen required to adequately test the zone.
The HPT system also can be used to collect static water pressure data at discrete intervals during the logging process. These static pressure data can be used to calculate static water levels or to create a piezometric profile for the log.
EC and HPT sensors are standard on all Geoprobe® probes including contaminant logging tools.
The instrumentation we are going to be using for HPT is the HPT controller, which is going to allow us to set our water flow that we’re going to be injecting out of the probe, it also is monitoring the up-hole pressure as well as recording the down-hole pressure that’s seen at the sensor.
We also have the field instrument which is collecting the data from the HPT controller. This is also going to be operating our electrical conductivity. Its got the circuit board for that and outputting the voltage. And collects all the data and transfers that to our field laptop.
The HPT probe, which is connected to the instruments via a trunkline. It looks like this and we have a 4 dipole EC wenner array for the collection of electrical conductivity for determining soil lithology. And then we have a screen on the side of the probe where we’re going to be injecting water into the formation. Directly above the probe, we’re going to have an HPT sensor, down-hole. And this sensor allows us to be able to record how much pressure its taking within the formation to inject the set flow of water that was initially setup in the controller.
With equipment setup, QA testing must be done before and after each log to ensure that the equipment is working properly and is generating good data. Testing includes an EC load test and HPT reference test. Depth is recorded by connecting a depth potentiometer to the unit. The flow of water is started. Once the HPT screen is at the ground surface, the trigger button in the software can be clicked.
The probe is advanced at a rate of 2 centimeters per second. Dissipation tests are completed in a zone of higher permeability indicated by lower HPT pressure. At least one dissipation test must be performed in order to calculate the static water level and estimated K (groundwater specific conductance) readings from the log. Dissipation tests need to be performed below the water table and are best in zones of higher permeability where the injection pressure can dissipate off quickly once the flow is shut off. This information gives us an accurate measurement of static water level in formation and calculate hydraulic conductivity.
The process its repeated until the predetermined log depth is reached or until refusal is attained.
After the logs are complete, operators can open them in the DI Viewer software to review, print and export the data for modeling. DI Viewer is a free software available on our website for all to use.
A typical HPT log consists of electrical conductivity, HPT pressure response, HPT flow rate, and estimated K. In general, both HPT pressure and EC values increase with decreasing grain size, and decrease with increasing grain size.
It is fairly common to see zones where EC readings and HPT pressure contradict one another. This can happen when there is poor mineralogy of the soil particles resulting in silt and clay soils with lower EC readings, silts intermixed with sand particles, and weathered bedrock may have low EC but would have low permeability.
Where we have cases of higher EC and lower HPT pressure typically is due to an ionic influence in the soil or groundwater. This log shows an ionic impact from an upgradient remediation fluid injection in a permeable formation on top of a silt-clay unit. Where the high EC with low HPT pressure readings are we see a rapid increase of estimated GW specific conductance. High EC readings from ionic impacts can range from very slight to higher than typical soil readings. Very high EC readings can occur when the probe contacts metallic objects or slag in the soil which will ground them out and typically result in hard sharp spikes in the EC data.
In cases where HPT and EC do not confirm one another it is important to take confirmation soil and/or groundwater samples to help understand the difference between the two graphs.
The HPT system from Geoprobe® is used to evaluate the hydraulic behavior of subsurface soil. The pressure response identifies the relative ability of soil to transmit water. For more information, visit our HPT webpage at geoprobe.com/hpt or call us at 785-825-1842.