
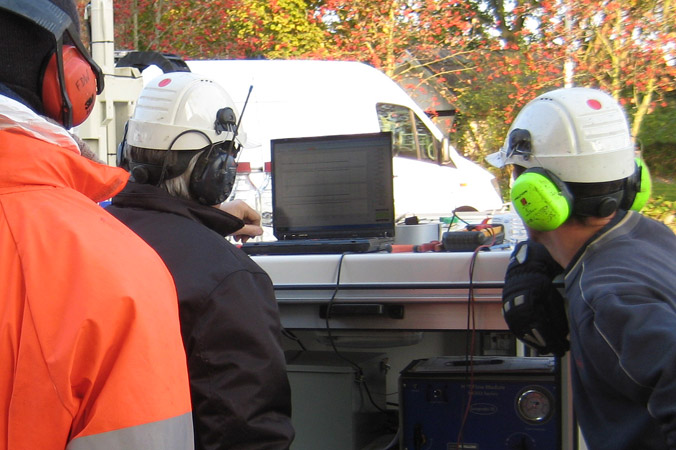
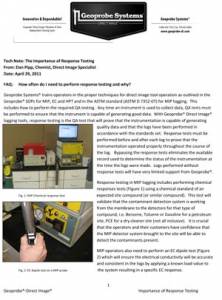
Viewing MIP readings as they occur.
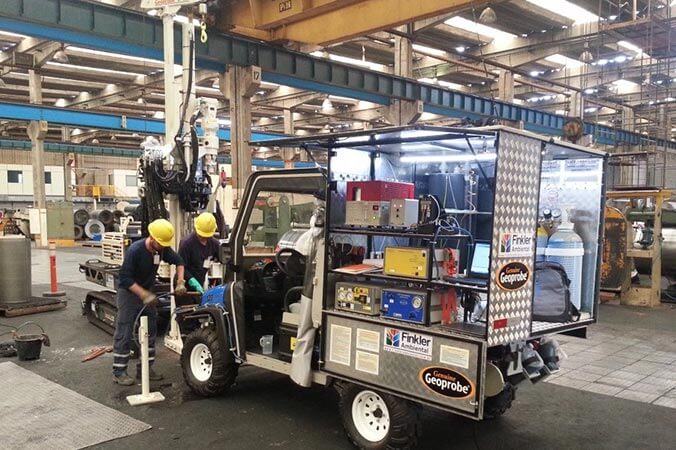
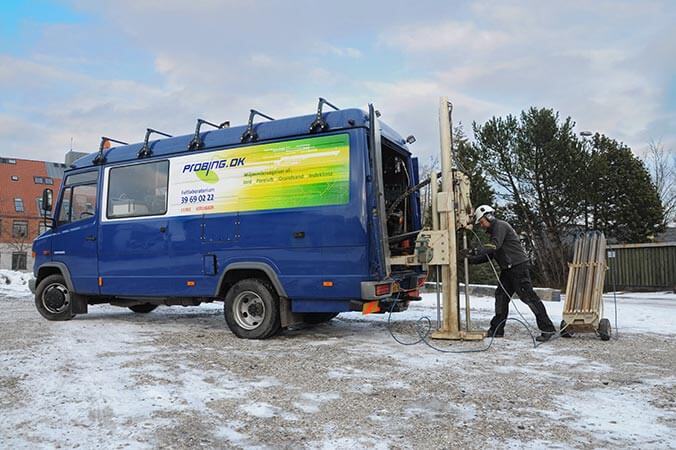
Preparing for an indoor MIHPT survey
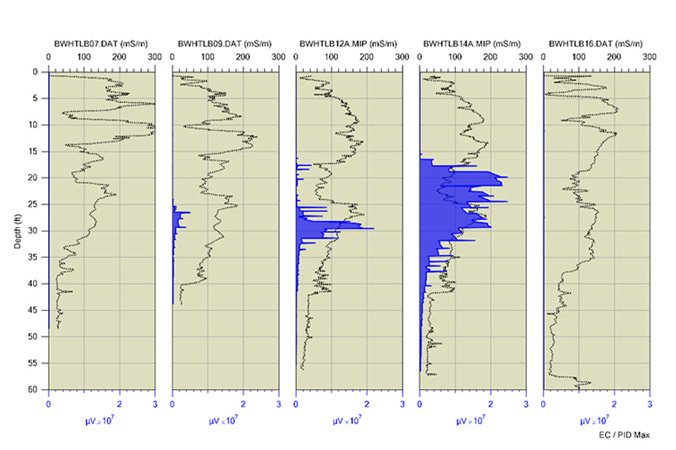
A series of MIP logs from a site contaminated with fuel hydrocarbons.
MIP Logging
MIHPT logging
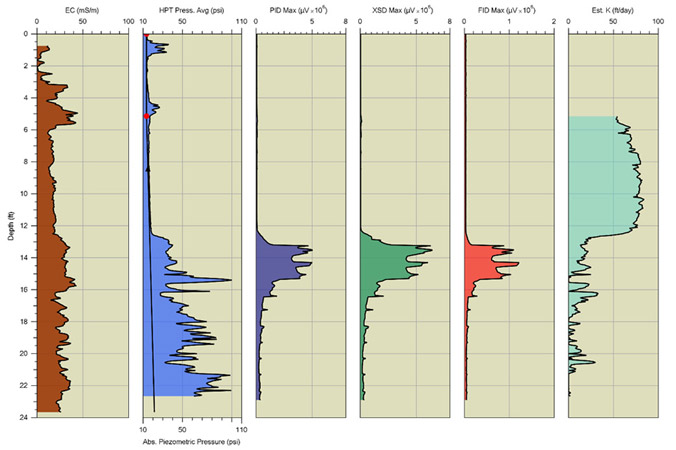
An MIHPT log includes (from left to right) an EC (electrical conductivity), HPT pressure (top axis) with absolute piezometric pressure (bottom axis), MIP-PID, XSD, and FID detector graphs and estimated hydraulic conductivity (K).
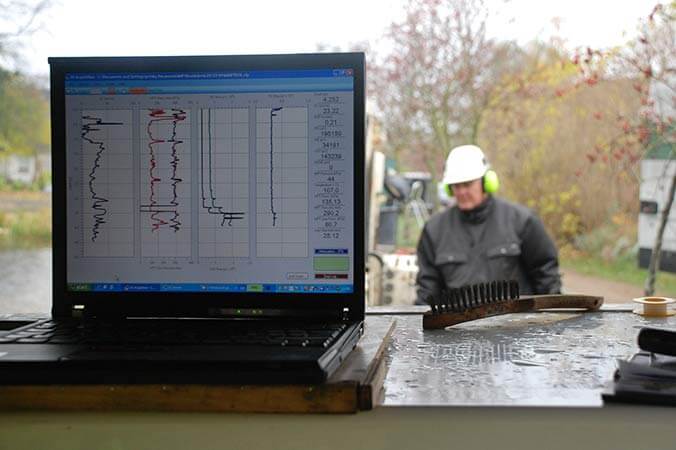
MIP computer setup
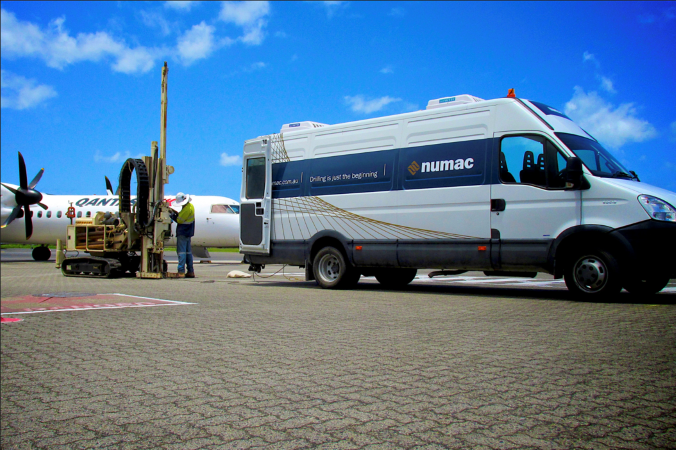
MIHPT logging at the airport
Log the Relative Concentration of Volatile Organic Compounds (VOCs) with Depth in Soil
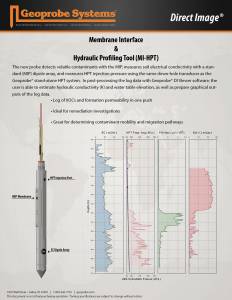
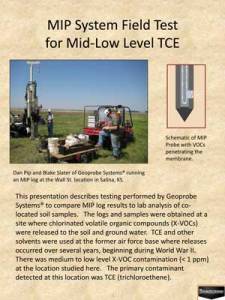
The MIP (membrane interface probe) logging tool measures volatile petroleum hydrocarbon and solvent contamination along with electrical conductivity of soil and permeability. An inert carrier gas continually sweeps behind a heated membrane in the probe and is then transported to a series of detectors at the surface. The detectors each respond to different analyte properties which allows the MIP operator to discern the contaminant to its family group as well as provide the ability to map out the contaminant plume from source to extent. Obtaining an understanding of electrical conductivity of soil and permeability along with the contaminant information allows the investigator to know if the VOC contamination is near to prominent migration pathways or bound up is a storage zone. This knowledge will greatly aid in how to approach site remedial efforts.
= Tool String Diagram (TSD)
MIP Overview
What is Geoprobe® Direct Image® MIP?
- Logs VOC contaminants and soil electrical conductivity (EC) and permeability (HPT) with depth.
- Shows distribution and relative magnitude of both halogenated and non-halogenated VOC contaminants.
- Works in both saturated and unsaturated soils.
- Detects contaminants in both coarse and fine-grained soils.
- Only tool capable of logging dissolved phase VOCs in situ in real time.
- Determine contaminant mobility and migration pathways with EC and HPT.
- Used worldwide for environmental site characterization of subsurface VOC contaminants.
- Standard tool configurations combine the MIP with other sensors for lithology and permeability logging.
- Real time contaminant screening information is generated, allowing field adjustment of the site investigation.
The MIP was developed by Geoprobe Systems® and is presently manufactured and sold exclusively by Geoprobe Systems® and its distribution agents. The MIP has been used extensively in the U.S. and Europe for mapping the extent of VOC contamination in the subsurface. As a logging tool, the MIP offers many benefits to site investigators as listed above.
The MIP (membrane interface probe) is a direct push tool used to log the relative concentration of volatile organic compounds (VOCs) with depth in soil. An example log made using an MIP System is shown below.
Video:
MIP (Membrane Interface Probe) Overview
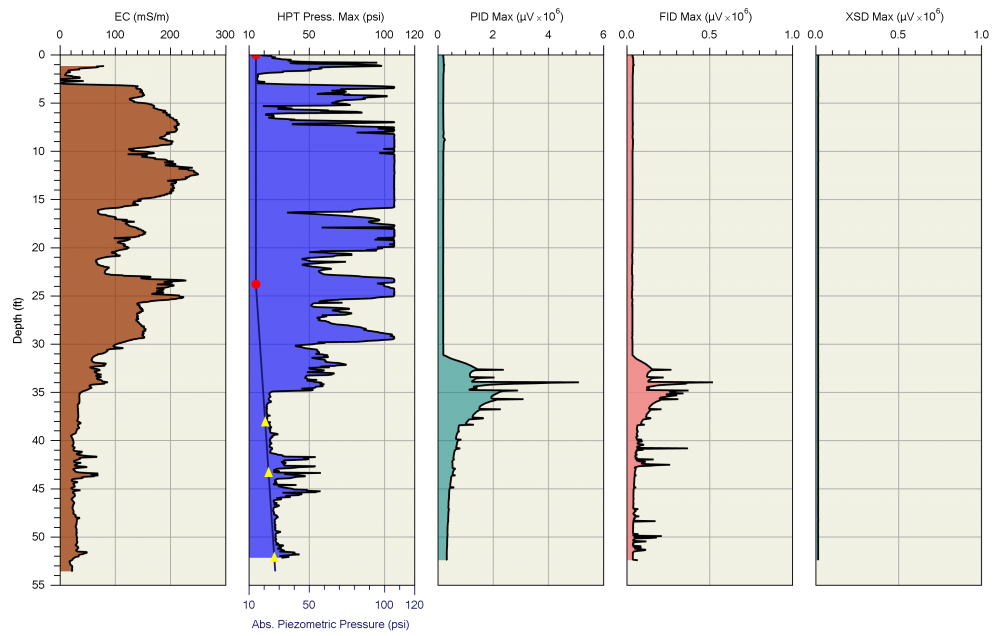
Figure 1:
A typical MIP log from a former gas station site: Graphs (left to right) Soil Electrical Conductivity, HPT Pressure with Absolute Piezometric Pressure and Static Water Level, Photoionization Detector, Flame Ionization Detector and Halogen Specific Detector
Principles of Operation
The Membrane Interface Probe (MIP) is a screening tool with semiquantitative capabilities acting as an interface between volatile contaminates at depth in the soil and gas phase detectors at the surface. The MIP membrane is semipermeable and is comprised of a thin film polymer impregnated into a stainless steel screen for support. The membrane is approximately 6.35mm in diameter and can be easily replaced. The membrane is placed in a heated block attached to the probe. This block is heated to approximately 100-120 degrees C as the probe is advanced into the soil. Heating the block accelerates anlayte diffusion across the membrane while at the same time minimizing membrane absorption. Diffusion across the membrane is driven by the concentration gradient between the contaminated soil and the clean carrier gas behind the membrane. A constant gas flow of 35-45 mL/min sweeps behind the membrane and carries the contaminants to the gas phase detectors at the surface. Travel time from the membrane interface to the detector(s) is approximately 30-60sec (depending on the length of trunkline and flow rate).
Video:
MIP Theory of Operation
Figure 2:
Principles of Operation: The downhole, permeable membrane serves as an interface to a detector at the surface. Volatiles in the subsurface diffuse across the membrane and partition into a stream of carrier gas where they can be swept to the detector. The membrane is heated so that travel by VOCs across this thin film is almost instantaneous. MIP acquisition software logs detector signal with depth.
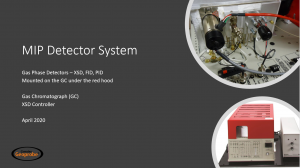
A typical MIP detector system utilizes three detectors: a PID (photoionization detector), FID (flame ionization detector) and an XSD (halogen specific detector). Each of these detectors respond to different traits of an analyte and the combination of all three provides the investigator with the ability to discern between typical contaminant types such as gasoline, chlorinated solvents and methane even when comingled. See the detector information tab for more specifics on detector operation and the example log tab to see how the detectors respond differently to varying contaminant family groups.
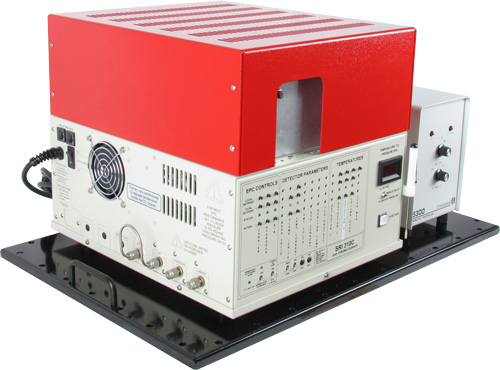
Figure 3:
MIP detector system, typically with three installed detectors: PID, FID, XSD
Example Logs
In practice, an MIP detector log is seldom used apart from a simultaneous log indicating lithology. This accompanying log typically is electrical conductivity (EC) of soil but can include or be replaced by hydraulic profile (HPT) or CPT parameters. The next two figures show the true power of combining lithology sensors with the MIP detectors in one profile. Both logs below show an MIHPT Log displaying EC (electrical conductivity of soil), HPT injection pressure (top axis) with absolute piezometric pressure (bottom axis), PID, FID, and XSD detector graphs, along with estimated hydraulic conductivity.
Note: Refer to the Geoprobe® MIP SOP for specific settings and gas flows of the MIP-PID, FID and XSD detectors.
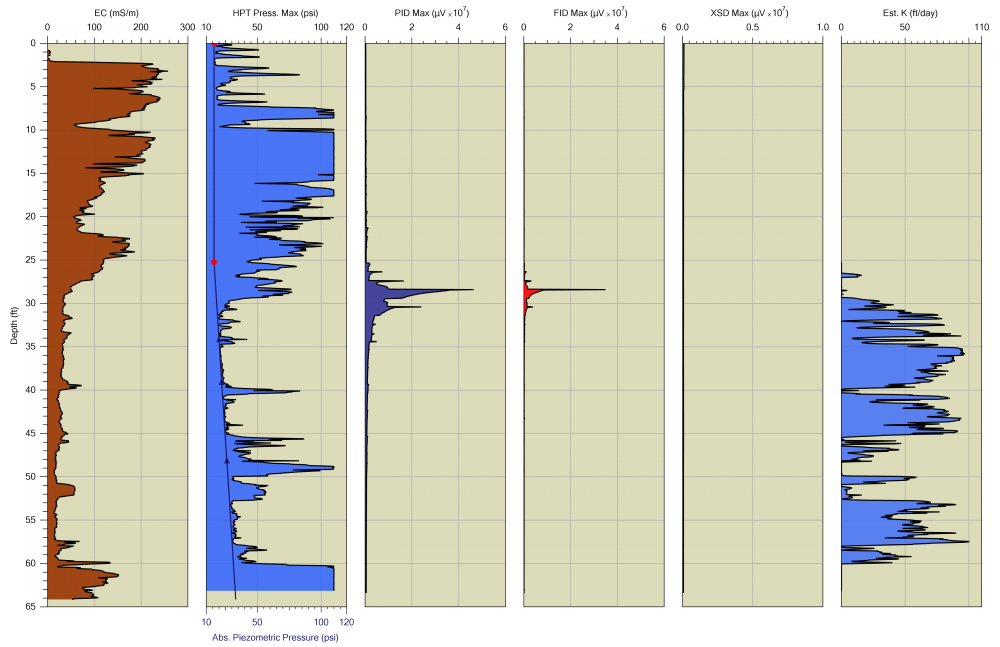
Figure 6:
A typical MIHPT log includes (from left to right) an EC (electrical conductivity of soil) log, HPT injection pressure (top axis) with Absolute Piezometric Pressure (bottom axis), MIP-PID, FID, and XSD detector graphs. The MIP-PID and FID graphs indicate most of the contaminant mass is located at depths of 25 to 32 feet. The EC and HPT graphs indicate there is a transition from a fine to coarse grain soil unit (lower permeability) at this depth.
The soil EC graph in the following log is not as clear to the changes in lithology transitional zones sand/silt/clay as in the previous log. This is likely due to differences in soil mineralogy of the region the log was performed. When EC is paired with the HPT, which is a measurement of the soil physical properties of permeability, operators can have greater confidence of subsurface lithological changes and better understand what is occurring when EC and HPT pressure do not mirror each other. When the EC and HPT pressure graphs diverge it may indicate zones of cemented sands or brine contamination.
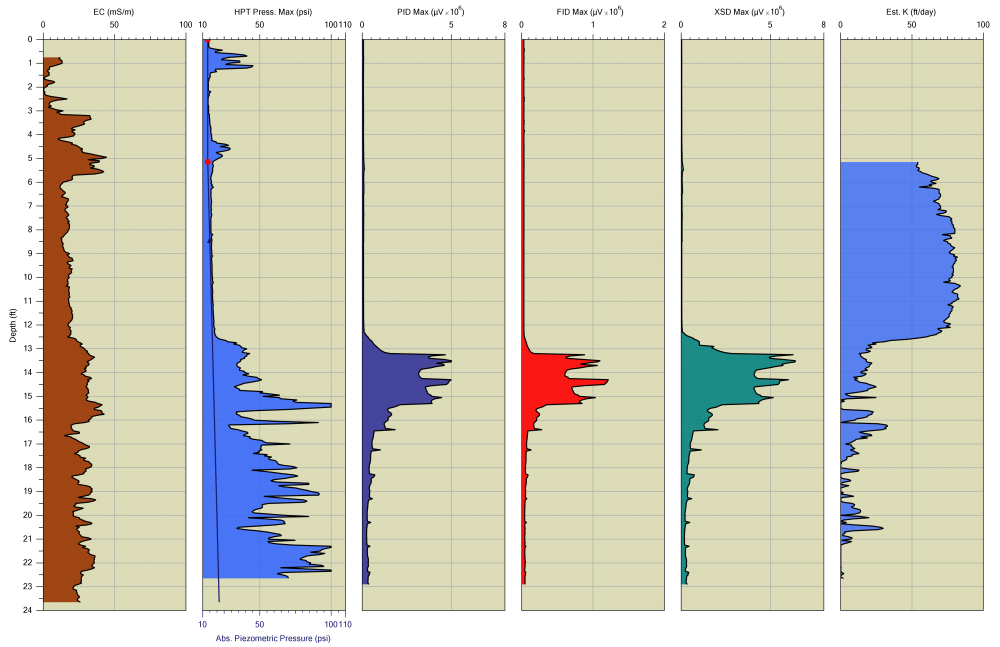
Figure 7:
An MIHPT log includes (from left to right) an EC, HPT injection pressure (top axis) with Absolute Piezometric Pressure (bottom axis), MIP-PID, FID and XSD detector graphs and estimated hydraulic conductivity (K). The MIP detectors indicates the majority of contaminant mass is positioned in a low permeable zone (note HPT higher pressure) at a depth of 13 to 16 feet. This log was obtained on a TCE contaminated site which is confirmed by the similar responses on the PID and XSD.
In practice, multiple MIP logs are used on a site to determine the location of a contaminant source area, to track the movement of a contaminant plume, to define the contaminant mass for remediation, or to investigate the efficiency of a remediation treatment. Whatever the purpose of the MIP logging, multiple logs are always be performed at any one site.
The MIP log shows the response of the MIP detectors with depth in the soil. The MIP data acquisition system makes this log by considering the travel time required for the membrane sweep gas to reach the MIP detectors at ground surface, thus converting the detector time data into MIP response with depth data. An example series of MIP logs from a contaminated site are shown in the following displayed log. The logs in this series, or cross section, show the response of the PID detector in the MIP system with depth. The contaminant at this site is a fuel hydrocarbon from a former gas station. This figure shows the main utility of MIP logs in that the position of the contaminant, which varies from location to location, is described by the MIP log. The concentration of the contaminant also varies across the site, which is described by the wide range of responses shown on the MIP logs in the cross section view.
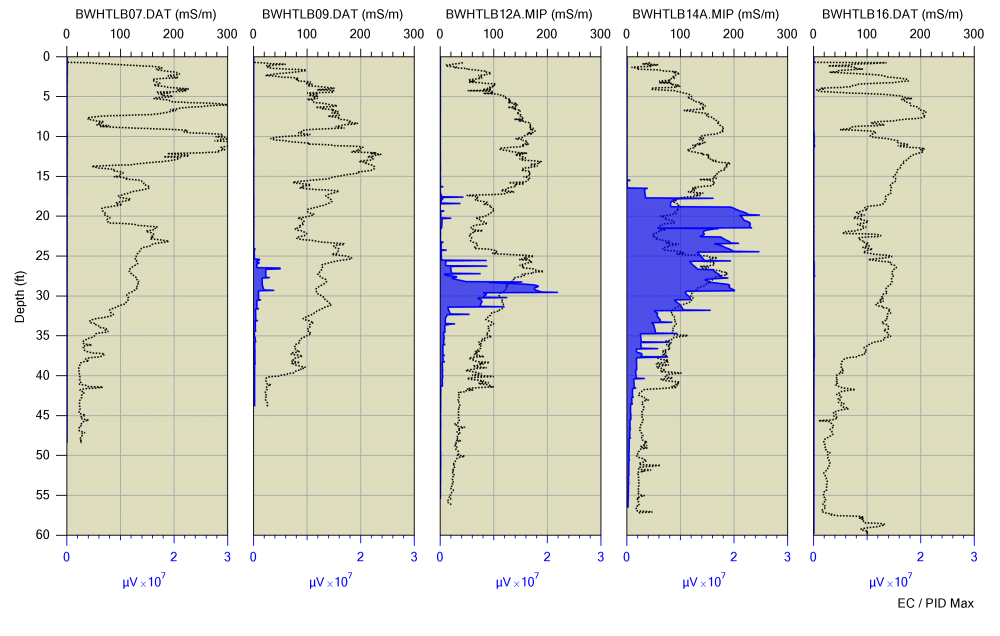
Figure 8:
A cross section of site MIP logs from a former gas station location. The graphs shown above are MIP-PID (photo ionization detector) graph shaded in blue along with EC (dashed black line). These logs illustrate the use of MIP in defining the depth at which contaminants are encountered. The concentration represented in each of these logs is also vastly different with all logs being set to the scale 3x10e7. These logs were performed approximately 16m apart on the same site.
DI Viewer is a free program, downloadable from the link below, which allows the user to display any of the Direct Image® log types (MIP, OIP, HPT, EC). With this program the user can display the raw data .zip files of each saved graph of an individual log in single log view or compare them to other logs using the overlay and cross sectional view functions. Log specific QA data is also accessible with this software which also allows one to print or export the logs data for 3D modeling or into .jpg or .png files.
Instrument Carriers
Having a quality method of carrying the Direct Image® instruments with an orderly layout is not always easy and can be made even more challenging with the differing vehicles operators use to bring the equipment to the field. Geoprobe® has designed three options, providing different levels of features to make this easier for field operators.
The Vertical Instrument Rack is designed as permanent storage option for your instruments inside a van or truck unit. This rack makes use of often unused vertical space and conserving limited countertop space. Fasten the rack to the floor and walls for a stable and secure home for your instruments. The shelves slide out for easy access to connection on the rear of the instruments and also allow the operator to easily tighten the securing straps or get inside the instrument if needed.
Benchtop Instrument Carrier is another option to secure your instruments together. There are mounting holes and hardware for secure the MIP-GC and breakout panel to the top. Front and rear panels allow for the enclosure of all instruments inside the box for transport or shipping (not including the GC) without undoing any of the cable connections. This option also makes it very easy to move from a vehicle setup to a smaller platform (mobile cart) when performing space limited inside work without needing to disconnect instruments from one another.
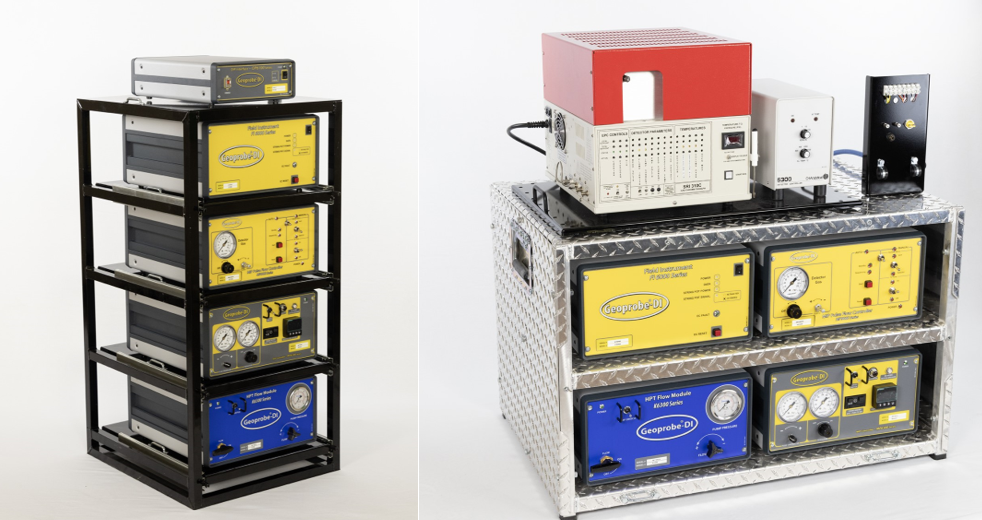
Figure 9:
Vertical and Benchtop Instrument Racks
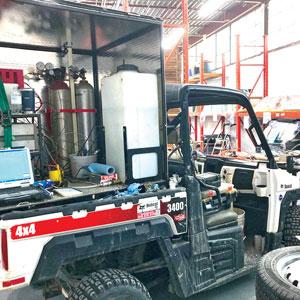
The ATV Instrument Carrier is designed as an all-terrain DI setup. This carrier also allows for the complete secured closure of the instruments with the additional wall panels with air flow between instruments. The instrument rack can be positioned in three of the four corners of the box for your customized layout and it includes a 30-gallon water tank, a lower horizontal gas bottle rack for your MIP carrier gases, dual 6-port powers strips wired directly to electrical plugs next to the bottle racks, and forklift pockets to get it easily on and off your ATV unit. This unit can also be freight shipped with to a job site leaving the instruments in place making for a quick start to a project.
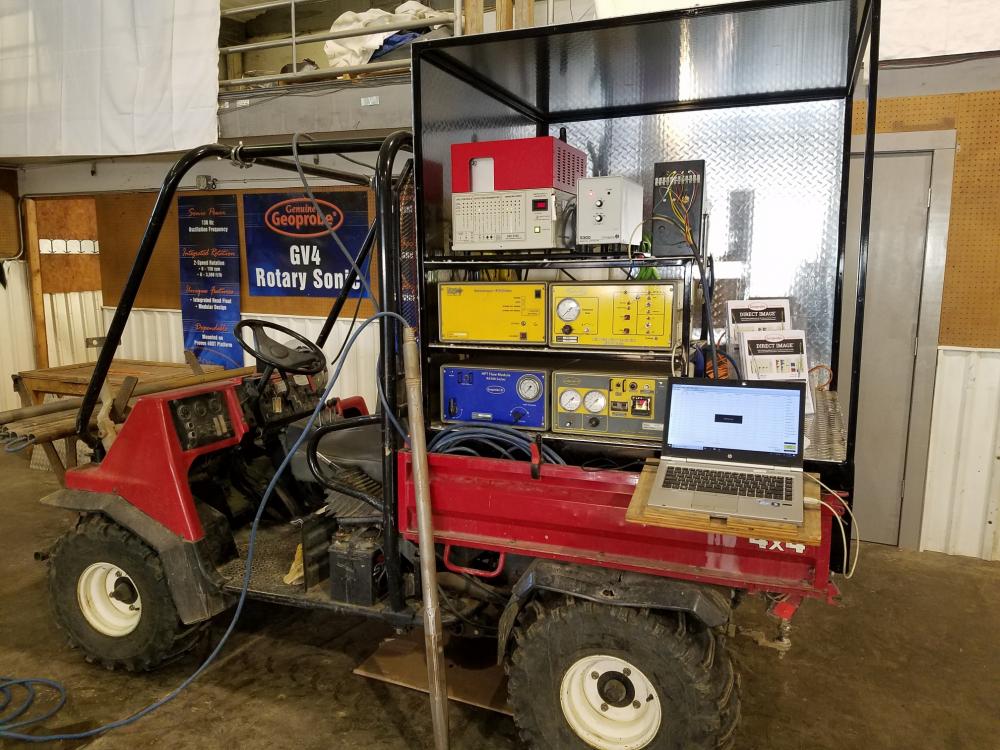
Figure 10:
ATV Instrument Rack (side view)
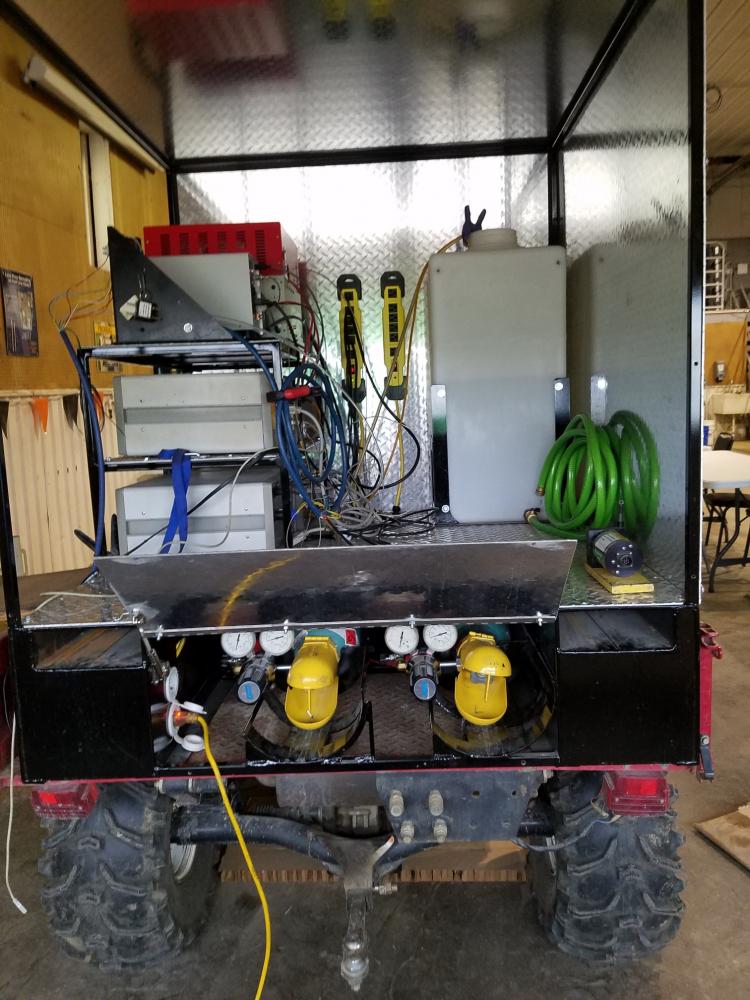
Figure 11:
ATV Instrument Rack (rear view)
Frequently Asked Questions
- Is the MIP a continuous sampling tool?
Yes. In standard MIP operation, the carrier gas stream continuously sweeps past the membrane and is transferred as a continuous stream to detectors at the surface. This occurs over the entire log depth not just when stopped at a specific interval, however it is at the stopped intervals that the probe/membrane is allowed to heat up and a “better” sample is collected.
- Does MIP work in the saturated and unsaturated zone?
Yes. Only the vapors will diffuse through the semi-permeable membrane which keeps waters out. VOC response will be seen both above and below the water table.
- Do soil types and or soil water content influence the systems detection limits?
Yes. Both can have an impact on the systems detection limits. Saturated soils tend to yield a slightly lower detection limit. Finer grained soils also tend to yield lower detection limits than coarser soils.
- What is the detection limit of the MIP?
- Hydrocarbons (BTEX)
- 0.20-2.0ppm with a PID
- Chlorinated solvents (TCE, PCE)
- 0.20-2.0ppm with an XSD-PID
- The low-level MIP method can produce detection limits 10x lower than standard MIP.
- Hydrocarbons (BTEX)
- What are the limiting factors for the Detection Limit?
- Detectors being used
- Detector maintenance level
- Membrane wear
- Pressure within the trunkline – based upon TL length and flow rate
- Rate of penetration into the subsurface
- Target compound boiling point Soil types
- Can the MIP be used for plume delineation?
Yes. The MIP is intended to be used to delineate volatile contaminant plumes. The MIP is designed as a mapping tool to locate source areas and for plume delineation down to 0.5ppm or more depending on the limiting factors of detection limits and if a specific low level MIP controller is being used.
- Can the MIP be used in the source area?
Yes. If you have a light petroleum VOC source such as gasoline or a chlorinated solvent such as PCE or lighter then MIP should work well to map out these source areas. When beginning work on a known source area operating a heated trunkline may help reduce the “carryover profile”. MIP logs will have an increased carryover profile when mapping sources areas of any heavier hydrocarbons such as diesel, jet fuels and motor oil due to their larger quantities of heavier molecules.
- Why and when would I choose to operate the MIP heated trunkline?
The use of this trunkline will keep the contaminants mobile in the trunkline which will produce better defined logs of the contaminants as well as keeps downtime between logs to a minimum. The heated trunkline should be used when you are expecting to operate in areas of high concentrations of gasoline or BTEX components including NAPLs of these compounds. High concentrations or DNAPLs of chlorinated solvents such as PCE or TCE would also benefit from the use of the heated trunkline. The heated trunkline will not help in the mapping of any heavier hydrocarbons such as diesel, jet fuels and motor oil instead it will increase their carryover profile. With these compounds the elevated temperature of the trunkline will slowly mobilize larger carbon chain molecules up to the detectors which will result in a very slurred log of contaminants. These larger carbon chain molecules would normally get cold trapped in the probe and early sections of the trunkline. The heated trunkline does not have HPT functions within the trunkline.
- Why is there carryover in my MIP logs?
The carryover profile in MIP logs is typically not the result of actually dragging contaminants down into the formation. When a MIP log is run through high concentration VOC zones it is common to see residual responses that taper off for the next 5-10ft. A portion of the diffusing contaminants will adsorb onto the membrane material which takes time to clear off which is accelerated with the probe heat cycling. The higher the boiling point of these compounds the longer it will take to desorb off of the membrane. Contaminants may also load up in the trunkline and take time to flush out. Another reason for the carryover profile is the presence of multiple compounds. In weathered gasoline and diesel there are large numbers of higher boiling point molecules which takes them longer to desorb off of the membrane as well as taking a longer time to travel through the trunkline resulting in much long trip times compared to the compound used to generate the logs trip time. All of this results in the software assigning their response to a depth perhaps well below the depth they originally encountered the membrane and carrier gas stream.
- How do contaminants move across the membrane?
Contaminants will cross the membrane by diffusion. The membrane is heated to encourage the contaminants to volatilize so they will more easily diffuse across the membrane. The concentration gradient in front of and behind the membrane also influences contaminant migration across the membrane.
- What detectors can be used with the MIP system?
Any lab grade gas phase detectors can be used.
- Standard Detectors: PID, FID, XSD
- Others include: ECD, DELCD, GCMS
- Can I determine contaminant concentration from my MIP logs?
No. Contaminant concentration cannot be directly determined from the MIP detector responses. The detectors are not able to be calibrated due to the changing subsurface conditions and influences that are encountered which cannot be reproduced at the surface resulting responses that are semi-quantitative. Variables that will influence detector response include soil type, water content, membrane wear, chemicals present and if there are mixes of different chemicals. The purpose of the chemical response test is to determine that the detector system is working consistently throughout the project.
- How can I best get a concentration value that corresponds to our MIP responses?
The best way to do this is to run a series of MIP logs and then begin to perform discrete confirmation sampling next to the log locations. Soil and/or water samples can be taken, where applicable, and analyzed either by fixed or mobile laboratories to determine specific contaminants and their concentrations. These results can then be plotted against the neighboring MIP responses to determine the relationship of concentration versus MIP response.
- How is MIHPT to be advanced into the subsurface?
When starting an MIHPT log the MIP membrane should be even with the ground surface, this is the zero point. Standard MIP advancement is done by advancing the probe in one-foot increments at a 2cm/sec rate between stopping points. When the probe is stopped at a sampling interval the operator is to wait for 45seconds for the MIP membrane block to heat up and for a consistent sample collection. Then the probe is advanced in ~15 seconds to the next sampling interval. The membrane is exposed for 45sec. in the response test and approximately the length of time it takes to add a rod. Stopping at each interval for 45seconds keeps the advancement and membrane exposure consistent. If the membrane exposure time is altered, it needs to be uniform across the site and in the response test to be able to compare the site data.
- Is there an ASTM standard for MIP?
Yes – ASTM D7352-18
- How do I view the data files?
All of the raw files generated by the MIP system can be opened with the DI Viewer. This is a free download off of our website.
- What is the testing procedure for the MIHPT system?
There are 3 different main sensors being operated on the MIHPT system and each one has a QA test that needs to be run to ensure the system is capable to generating good data.
- MIP – Chemical response test – the membrane is exposed to a solution containing a known chemical at a known concentration(s).
- EC – EC Dipole test – a low and high-level test load is applied between the dipole and body of the probe to check the EC system.
- HPT – HPT Reference test – evaluates the HPT sensors capability to accurately measure a column of water. This test also can ensure that there is no debris behind the HPT screen.
Detector Information
Laboratory grade, gas phase detectors are needed for the detection of volatile organic contaminants in the carrier gas stream. The gas phase detectors are typically mounted on a gas chromatograph (GC). The standard detector setup uses a PID, FID and XSD detector, however, different models of GCs and detectors can be used with a MIP system. The use of multiple detectors is helpful for determining compound class but not individual volatile compounds. Certain detectors may be operated in series for the detection of different contaminant types. A brief discussion of commonly used detectors with the MIP system is provided below.
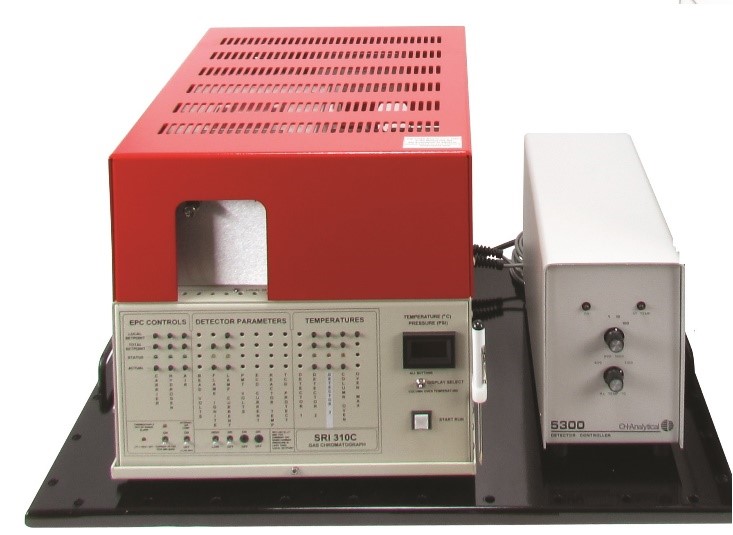
Figure 4:
Common Gas Chromatograph with Gas Phase Detectors used in MIP Operations
When the carrier gas from the probe returns to the surface and enters the detector system, it first passes through a nafion dryer to remove potential moisture from the carrier gas stream and then flows into the photoionization detector (PID) which is a non-destructive detector. From the PID the carrier gas returns to the GC oven and is split between the flame ionization detector (FID) and the halogen specific detector (XSD) which are both destructive detectors. Analyte response is seen as a current response within each detector.
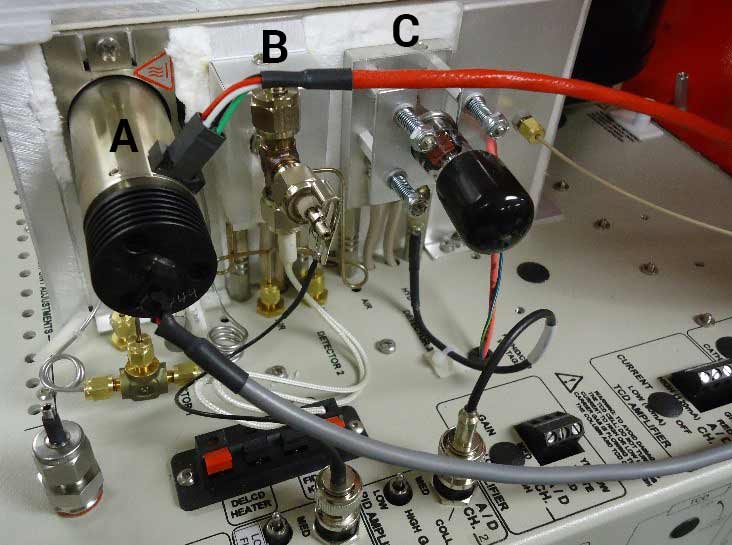
Figure 5:
Common Gas Phase Detectors: (A) XSD, (B) FID, (C) PID
A Guide to Analyte Detection Levels1 in Bulk Formation with Typical MIP System2 & Detectors
| Detector | BTEX | Gasoline3 | Diesel3 | TCE, PCE | CCl4 | DCE | VC | DCA, TCA | CH4 |
|---|---|---|---|---|---|---|---|---|---|
| PID | 0.5 to 5 ppm | 3 to 10+ppm | 10 to 25+ppm | 0.5 to 3 ppm | ND | 1 to 10 ppm | >5 ppm | ND | ND |
| FID | 3 to 25 ppm | 3 to 10 ppm | 3 to 25 ppm | 20 to 50+ ppm4 | >500 ppm4 | 20 to 50+ ppm | >50 ppm | 10 to 50+ ppm | 2,500+ ppm |
| (~0.25%) | |||||||||
| XSD | NA | NA | NA | 0.2 to 1.0 ppm | 0.2 to 1.0 ppm | 0.2 to 1.0 ppm | 0.2 to 1.0 ppm | 0.2 to 0.5 ppm | ND |
| ECD5 | NA | NA | NA | 0.2 to 1.0 ppm | 0.1 to 1.0 ppm | 25 to >100 ppm | >100 ppm | 1 to 25 ppm | ND |
PID: photo-ionization detector, FID: flame ionization detector, XSD: halogen specific detector, ECD: electron capture detector
BTEX: benzene, toluene, ethyl benzene and the xylenes. TCE: trichloroethylene, PCE: perchloroethylene, CCl4: carbon tetrachloride, DCE: dichloroethylene, VC: vinyl chloride, DCA: dichloroethane, TCA: trichloroethane, CH4: methane, ND: nondetect, ppm: parts per million.
1 These detection ranges are provided as a general guide, they may vary significantly depending on MIP system maintenance and detector optimization. Recommend MIP trunkline pressure of 10psi (~70kPa) for optimum detection. Increased trunkline pressure will decrease sensitivity. Degradation of complex analytes like fuels, weathering and soil matrix factors such as permeability, clay content, degree of saturation, organic carbon content, etc. will also influence the level of detection achieved.
2 Low level MIP systems can provide detection levels as much as 10X lower than listed here. Achievable level depends on specific analyte(s), detector and system optimization.
3 Fuels will respond at higher concentrations after biodegradation, weathering and loss of volatile fractions in the environment. Extreme weathering can greatly reduce detectability of fuels. Heavier fuels like diesel result in excess membrane carryover and poor resolution of contaminant vertical extent (apparent “drag down”).
4 When used in conjunction with the XSD detector the FID response may help identify zones where DNAPL could be present. Sample to verify.
5 Because of the ECDs high sensitivity to analytes like TCE, PCE and CCl4 it should not be used to define the presence of DNAPL formed by these contaminants. Use of the XSD in tandem with FID will prove more useful for this application.
Photo Ionization Detector (PID) - The PID uses ultraviolet radiation to ionize molecules in the effluent of the MIP carrier gas stream for analyte detection. The PID is a non-destructive detector and can therefore be used in series with other detector types. For a compound to be detected by a PID the chemical must have an ionization potential below the electron voltage of the PID lamp. The most common PID lamp used with the MIP is 10.6eV.
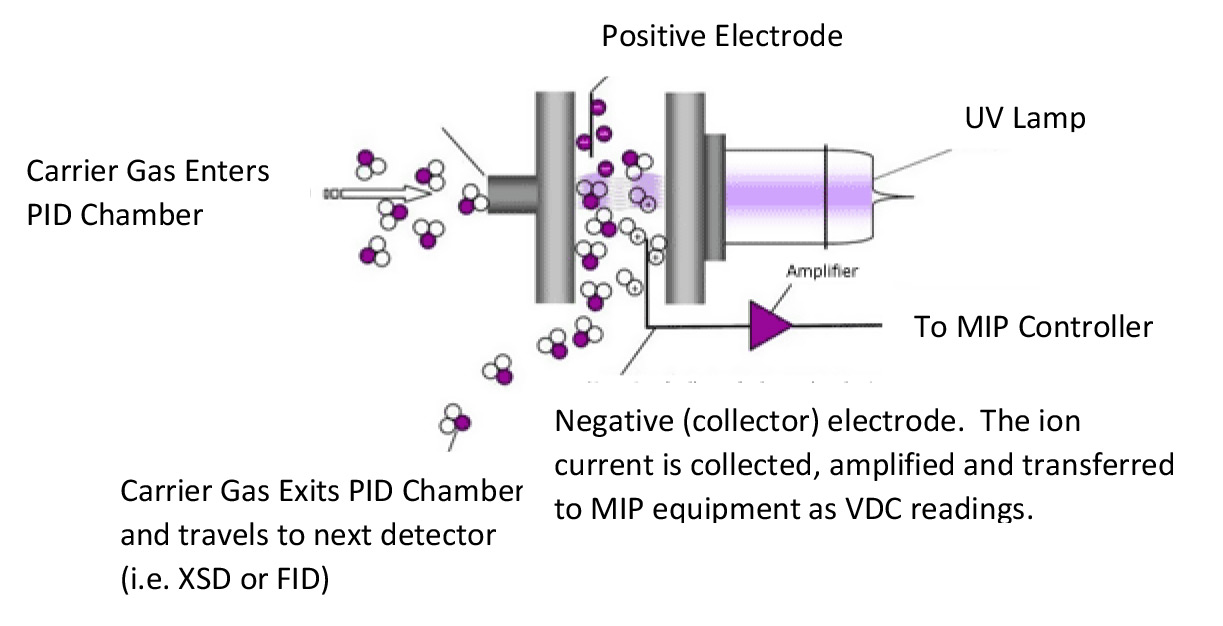
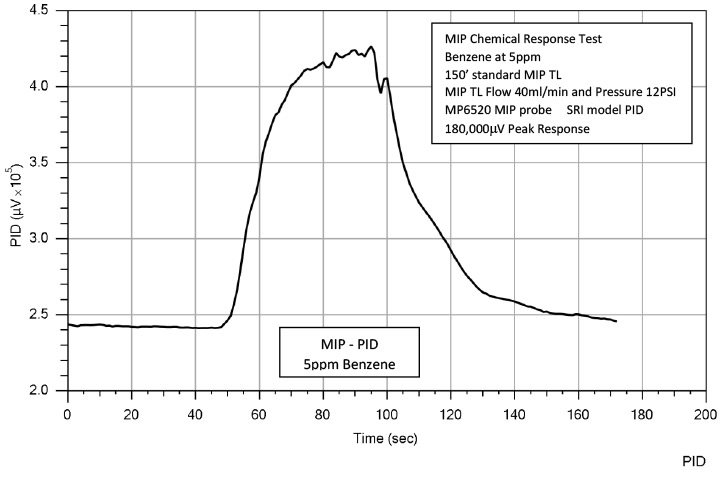
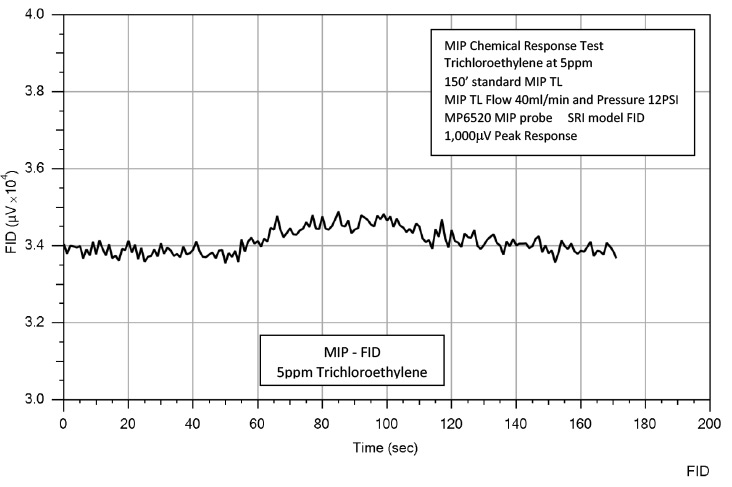
The PID is generally used for detection of aromatic hydrocarbons such as benzene and toluene and double bonded chlorinated compounds such as trichloroethylene and perchloroethylene. Below are some example responses of the PID to these compounds.
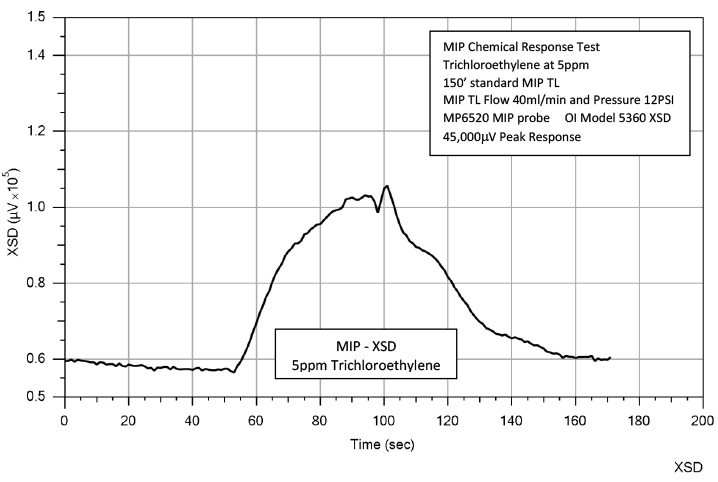
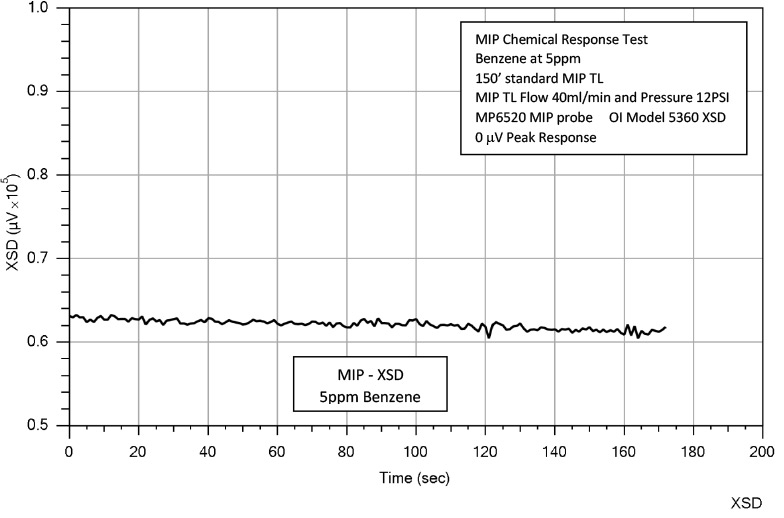
Halogen Specific Detector (XSD) – The XSD operates in an oxidative state that converts halogenated organics into free halogen atoms. These halogen (X) atoms are adsorbed onto the activated platinum surface of the detector probe assembly resulting in an increase thermionic emission. This emission current comprised of free electrons, negative and positive ions which provides a corresponding voltage that is measured via an electrometer circuit in the detector controller. The XSD is a destructive detector used for the detection of total halogenated VOCs in the MIP system.
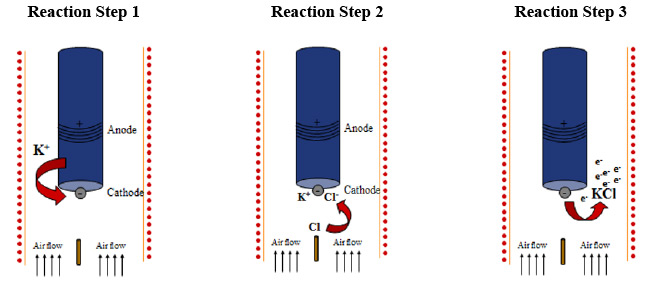
The XSD is not sensitive to nonhalogenated hydrocarbons making it an excellent detector in mixed fuel and solvent plumes. Below are some example responses of the XSD to these compounds.
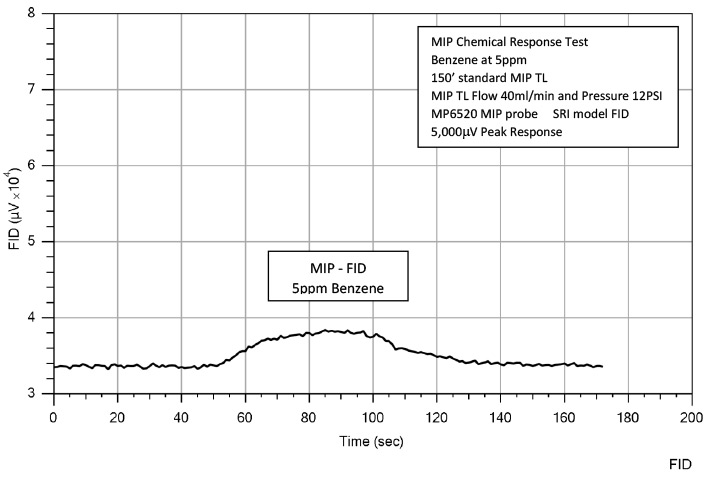
Flame Ionization Detector (FID) - The FID uses a hydrogen/air flame to produce ions and electrons that can conduct electricity through the flame. A potential is applied across the burner tip and the collector electrode. The resulting current is then amplified and recorded.
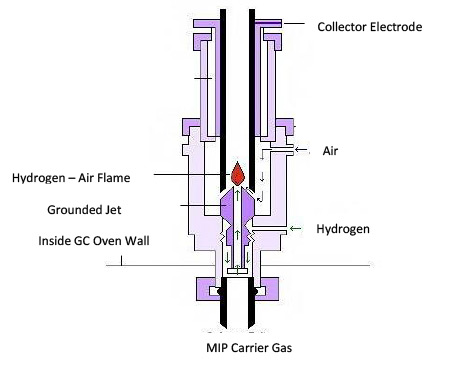
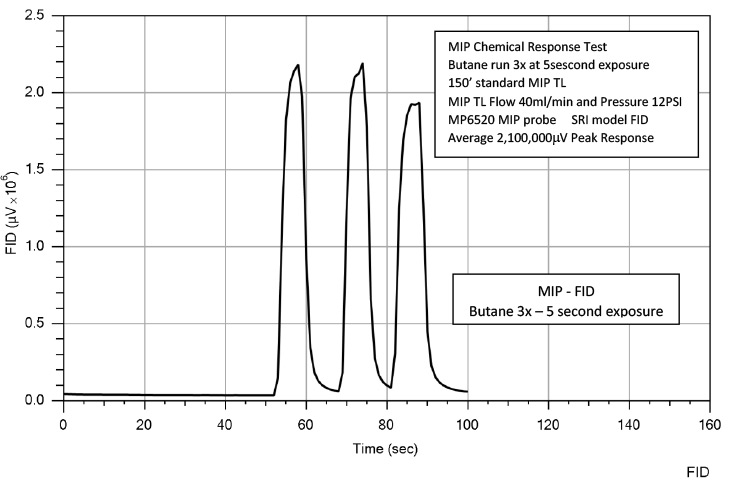
The FID will respond to any VOCs at a high enough concentration. The FID has a lower sensitivity to common VOC analytes than other detectors and typically serves as a confirmation detector run in tandem with the PID and XSD however it is the primary detector for mapping methane impacts since it does not show up on the other detectors. Below are some example responses of the FID to specific compounds.
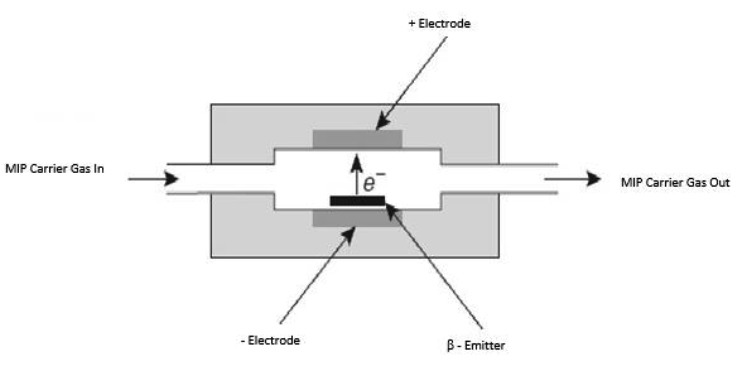
Electron Capture Detector (ECD) - The ECD operates by passing the effluent of the MIP carrier gas over a beta-emitter, typically nickel-63, causing ionization of the carrier gas and the production of electrons. In the presence of molecules that tend to capture electrons the current will decrease. This decrease in current is then measured and recorded.
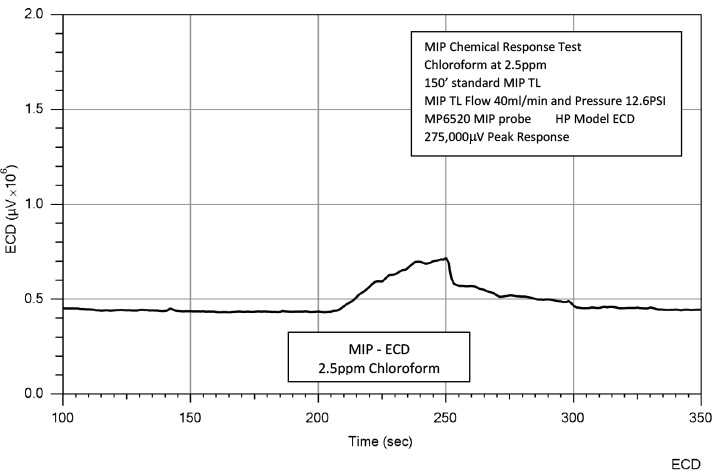
In the MIP system, the ECD is used primarily for the detection of halogenated VOCs. The ECD is increasingly sensitive to the number of halogens on a molecule. The ECD response varies depending upon the compound present and the number of halogen atoms on the molecule and the structure of the molecule. The ECD is most appropriately used for single contaminant sites containing low to moderate levels of multi-halogenated VOCs such as TCE, PCE and carbon tetrachloride. Below are some example responses of an ECD to 2.5ppm of chlorofrom, TCE and PCE.
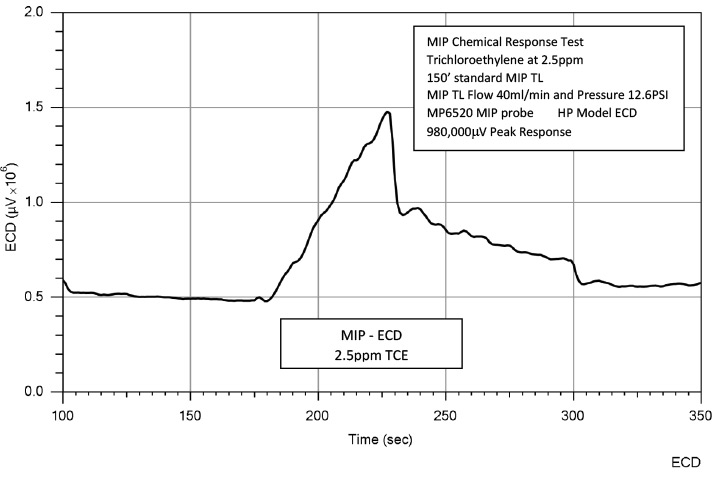
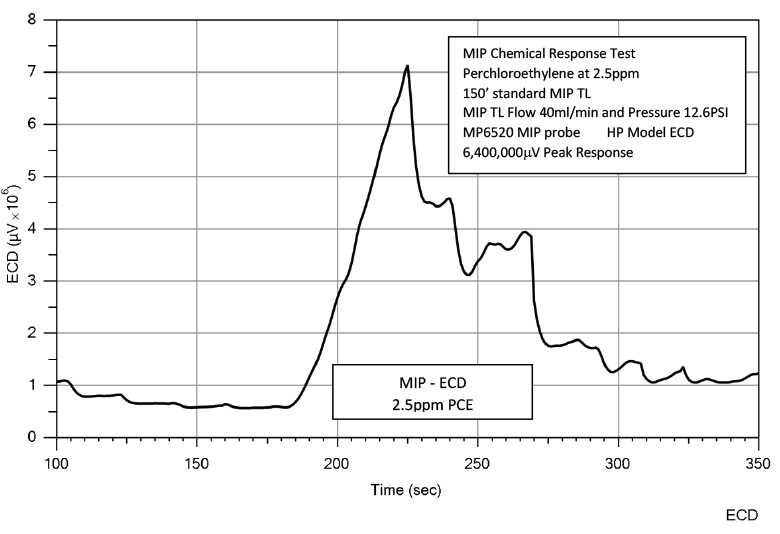
Watch the video: https://geoprobe.com/videos/ecd-and-xsd-comparison
Features & Options
MIP Probe
What is Geoprobe® Direct Image® MIP?
- Logs VOC contaminants and soil electrical conductivity (EC) and permeability (HPT) with depth.
- Shows distribution and relative magnitude of both halogenated and non-halogenated VOC contaminants.
- Works in both saturated and unsaturated soils.
- Detects contaminants in both coarse and fine-grained soils.
- Only tool capable of logging dissolved phase VOCs in situ in real time.
- Determine contaminant mobility and migration pathways with EC and HPT.
- Used worldwide for environmental site characterization of subsurface VOC contaminants.
- Standard tool configurations combine the MIP with other sensors for lithology and permeability logging.
- Real time contaminant screening information is generated, allowing field adjustment of the site investigation.
The MIP was developed by Geoprobe Systems® and is presently manufactured and sold exclusively by Geoprobe Systems® and its distribution agents. The MIP has been used extensively in the U.S. and Europe for mapping the extent of VOC contamination in the subsurface. As a logging tool, the MIP offers many benefits to site investigators as listed above.
The MIP (membrane interface probe) is a direct push tool used to log the relative concentration of volatile organic compounds (VOCs) with depth in soil. An example log made using an MIP System is shown below.
Video: MIP (Membrane Interface Probe) Overview
Figure 1:
A typical MIP log from a former gas station site: Graphs (left to right) Soil Electrical Conductivity, HPT Pressure with Absolute Piezometric Pressure and Static Water Level, Photoionization Detector, Flame Ionization Detector and Halogen Specific Detector
The Membrane Interface Probe (MIP) is a screening tool with semiquantitative capabilities acting as an interface between volatile contaminates at depth in the soil and gas phase detectors at the surface. The MIP membrane is semipermeable and is comprised of a thin film polymer impregnated into a stainless steel screen for support. The membrane is approximately 6.35mm in diameter and can be easily replaced. The membrane is placed in a heated block attached to the probe. This block is heated to approximately 100-120 degrees C as the probe is advanced into the soil. Heating the block accelerates anlayte diffusion across the membrane while at the same time minimizing membrane absorption. Diffusion across the membrane is driven by the concentration gradient between the contaminated soil and the clean carrier gas behind the membrane. A constant gas flow of 35-45 mL/min sweeps behind the membrane and carries the contaminants to the gas phase detectors at the surface. Travel time from the membrane interface to the detector(s) is approximately 30-60sec (depending on the length of trunkline and flow rate).
Video: MIP Theory of Operation
Figure 2:
Principles of Operation: The downhole, permeable membrane serves as an interface to a detector at the surface. Volatiles in the subsurface diffuse across the membrane and partition into a stream of carrier gas where they can be swept to the detector. The membrane is heated so that travel by VOCs across this thin film is almost instantaneous. MIP acquisition software logs detector signal with depth.
A typical MIP detector system utilizes three detectors: a PID (photoionization detector), FID (flame ionization detector) and an XSD (halogen specific detector). Each of these detectors respond to different traits of an analyte and the combination of all three provides the investigator with the ability to discern between typical contaminant types such as gasoline, chlorinated solvents and methane even when comingled. See the detector information tab for more specifics on detector operation and the example log tab to see how the detectors respond differently to varying contaminant family groups.
Figure 3:
MIP detector system, typically with three installed detectors: PID, FID, XSD
Laboratory grade, gas phase detectors are needed for the detection of volatile organic contaminants in the carrier gas stream. The gas phase detectors are typically mounted on a gas chromatograph (GC). The standard detector setup uses a PID, FID and XSD detector, however, different models of GCs and detectors can be used with a MIP system. The use of multiple detectors is helpful for determining compound class but not individual volatile compounds. Certain detectors may be operated in series for the detection of different contaminant types. A brief discussion of commonly used detectors with the MIP system is provided below.
Figure 4:
Common Gas Chromatograph with Gas Phase Detectors used in MIP Operations
When the carrier gas from the probe returns to the surface and enters the detector system, it first passes through a nafion dryer to remove potential moisture from the carrier gas stream and then flows into the photoionization detector (PID) which is a non-destructive detector. From the PID the carrier gas returns to the GC oven and is split between the flame ionization detector (FID) and the halogen specific detector (XSD) which are both destructive detectors. Analyte response is seen as a current response within each detector.
Figure 5:
Common Gas Phase Detectors: (A) XSD, (B) FID, (C) PID
A Guide to Analyte Detection Levels1 in Bulk Formation with Typical MIP System2 & Detectors
| Detector | BTEX | Gasoline3 | Diesel3 | TCE, PCE | CCl4 | DCE | VC | DCA, TCA | CH4 |
|---|---|---|---|---|---|---|---|---|---|
| PID | 0.5 to 5 ppm | 3 to 10+ppm | 10 to 25+ppm | 0.5 to 3 ppm | ND | 1 to 10 ppm | >5 ppm | ND | ND |
| FID | 3 to 25 ppm | 3 to 10 ppm | 3 to 25 ppm | 20 to 50+ ppm4 | >500 ppm4 | 20 to 50+ ppm | >50 ppm | 10 to 50+ ppm | 2,500+ ppm |
| (~0.25%) | |||||||||
| XSD | NA | NA | NA | 0.2 to 1.0 ppm | 0.2 to 1.0 ppm | 0.2 to 1.0 ppm | 0.2 to 1.0 ppm | 0.2 to 0.5 ppm | ND |
| ECD5 | NA | NA | NA | 0.2 to 1.0 ppm | 0.1 to 1.0 ppm | 25 to >100 ppm | >100 ppm | 1 to 25 ppm | ND |
PID: photo-ionization detector, FID: flame ionization detector, XSD: halogen specific detector, ECD: electron capture detector
BTEX: benzene, toluene, ethyl benzene and the xylenes. TCE: trichloroethylene, PCE: perchloroethylene, CCl4: carbon tetrachloride, DCE: dichloroethylene, VC: vinyl chloride, DCA: dichloroethane, TCA: trichloroethane, CH4: methane, ND: nondetect, ppm: parts per million.
1 These detection ranges are provided as a general guide, they may vary significantly depending on MIP system maintenance and detector optimization. Recommend MIP trunkline pressure of 10psi (~70kPa) for optimum detection. Increased trunkline pressure will decrease sensitivity. Degradation of complex analytes like fuels, weathering and soil matrix factors such as permeability, clay content, degree of saturation, organic carbon content, etc. will also influence the level of detection achieved.
2 Low level MIP systems can provide detection levels as much as 10X lower than listed here. Achievable level depends on specific analyte(s), detector and system optimization.
3 Fuels will respond at higher concentrations after biodegradation, weathering and loss of volatile fractions in the environment. Extreme weathering can greatly reduce detectability of fuels. Heavier fuels like diesel result in excess membrane carryover and poor resolution of contaminant vertical extent (apparent “drag down”).
4 When used in conjunction with the XSD detector the FID response may help identify zones where DNAPL could be present. Sample to verify.
5 Because of the ECDs high sensitivity to analytes like TCE, PCE and CCl4 it should not be used to define the presence of DNAPL formed by these contaminants. Use of the XSD in tandem with FID will prove more useful for this application.
Photo Ionization Detector (PID) - The PID uses ultraviolet radiation to ionize molecules in the effluent of the MIP carrier gas stream for analyte detection. The PID is a non-destructive detector and can therefore be used in series with other detector types. For a compound to be detected by a PID the chemical must have an ionization potential below the electron voltage of the PID lamp. The most common PID lamp used with the MIP is 10.6eV.
The PID is generally used for detection of aromatic hydrocarbons such as benzene and toluene and double bonded chlorinated compounds such as trichloroethylene and perchloroethylene. Below are some example responses of the PID to these compounds.
Halogen Specific Detector (XSD) – The XSD operates in an oxidative state that converts halogenated organics into free halogen atoms. These halogen (X) atoms are adsorbed onto the activated platinum surface of the detector probe assembly resulting in an increase thermionic emission. This emission current comprised of free electrons, negative and positive ions which provides a corresponding voltage that is measured via an electrometer circuit in the detector controller. The XSD is a destructive detector used for the detection of total halogenated VOCs in the MIP system.
The XSD is not sensitive to nonhalogenated hydrocarbons making it an excellent detector in mixed fuel and solvent plumes. Below are some example responses of the XSD to these compounds.
Flame Ionization Detector (FID) - The FID uses a hydrogen/air flame to produce ions and electrons that can conduct electricity through the flame. A potential is applied across the burner tip and the collector electrode. The resulting current is then amplified and recorded.
The FID will respond to any VOCs at a high enough concentration. The FID has a lower sensitivity to common VOC analytes than other detectors and typically serves as a confirmation detector run in tandem with the PID and XSD however it is the primary detector for mapping methane impacts since it does not show up on the other detectors. Below are some example responses of the FID to specific compounds.
Electron Capture Detector (ECD) - The ECD operates by passing the effluent of the MIP carrier gas over a beta-emitter, typically nickel-63, causing ionization of the carrier gas and the production of electrons. In the presence of molecules that tend to capture electrons the current will decrease. This decrease in current is then measured and recorded.
In the MIP system, the ECD is used primarily for the detection of halogenated VOCs. The ECD is increasingly sensitive to the number of halogens on a molecule. The ECD response varies depending upon the compound present and the number of halogen atoms on the molecule and the structure of the molecule. The ECD is most appropriately used for single contaminant sites containing low to moderate levels of multi-halogenated VOCs such as TCE, PCE and carbon tetrachloride. Below are some example responses of an ECD to 2.5ppm of chlorofrom, TCE and PCE.
Watch the video: https://geoprobe.com/videos/ecd-and-xsd-comparison
In practice, an MIP detector log is seldom used apart from a simultaneous log indicating lithology. This accompanying log typically is electrical conductivity (EC) of soil but can include or be replaced by hydraulic profile (HPT) or CPT parameters. The next two figures show the true power of combining lithology sensors with the MIP detectors in one profile. Both logs below show an MIHPT Log displaying EC (electrical conductivity of soil), HPT injection pressure (top axis) with absolute piezometric pressure (bottom axis), PID, FID, and XSD detector graphs, along with estimated hydraulic conductivity.
Note: Refer to the Geoprobe® MIP SOP for specific settings and gas flows of the MIP-PID, FID and XSD detectors.
Figure 6:
A typical MIHPT log includes (from left to right) an EC (electrical conductivity of soil) log, HPT injection pressure (top axis) with Absolute Piezometric Pressure (bottom axis), MIP-PID, FID, and XSD detector graphs. The MIP-PID and FID graphs indicate most of the contaminant mass is located at depths of 25 to 32 feet. The EC and HPT graphs indicate there is a transition from a fine to coarse grain soil unit (lower permeability) at this depth.
The soil EC graph in the following log is not as clear to the changes in lithology transitional zones sand/silt/clay as in the previous log. This is likely due to differences in soil mineralogy of the region the log was performed. When EC is paired with the HPT, which is a measurement of the soil physical properties of permeability, operators can have greater confidence of subsurface lithological changes and better understand what is occurring when EC and HPT pressure do not mirror each other. When the EC and HPT pressure graphs diverge it may indicate zones of cemented sands or brine contamination.
Figure 7:
An MIHPT log includes (from left to right) an EC, HPT injection pressure (top axis) with Absolute Piezometric Pressure (bottom axis), MIP-PID, FID and XSD detector graphs and estimated hydraulic conductivity (K). The MIP detectors indicates the majority of contaminant mass is positioned in a low permeable zone (note HPT higher pressure) at a depth of 13 to 16 feet. This log was obtained on a TCE contaminated site which is confirmed by the similar responses on the PID and XSD.
In practice, multiple MIP logs are used on a site to determine the location of a contaminant source area, to track the movement of a contaminant plume, to define the contaminant mass for remediation, or to investigate the efficiency of a remediation treatment. Whatever the purpose of the MIP logging, multiple logs are always be performed at any one site.
The MIP log shows the response of the MIP detectors with depth in the soil. The MIP data acquisition system makes this log by considering the travel time required for the membrane sweep gas to reach the MIP detectors at ground surface, thus converting the detector time data into MIP response with depth data. An example series of MIP logs from a contaminated site are shown in the following displayed log. The logs in this series, or cross section, show the response of the PID detector in the MIP system with depth. The contaminant at this site is a fuel hydrocarbon from a former gas station. This figure shows the main utility of MIP logs in that the position of the contaminant, which varies from location to location, is described by the MIP log. The concentration of the contaminant also varies across the site, which is described by the wide range of responses shown on the MIP logs in the cross section view.
Figure 8:
A cross section of site MIP logs from a former gas station location. The graphs shown above are MIP-PID (photo ionization detector) graph shaded in blue along with EC (dashed black line). These logs illustrate the use of MIP in defining the depth at which contaminants are encountered. The concentration represented in each of these logs is also vastly different with all logs being set to the scale 3x10e7. These logs were performed approximately 16m apart on the same site.
DI Viewer is a free program, downloadable from the link below, which allows the user to display any of the Direct Image® log types (MIP, OIP, HPT, EC). With this program the user can display the raw data .zip files of each saved graph of an individual log in single log view or compare them to other logs using the overlay and cross sectional view functions. Log specific QA data is also accessible with this software which also allows one to print or export the logs data for 3D modeling or into .jpg or .png files.
Having a quality method of carrying the Direct Image® instruments with an orderly layout is not always easy and can be made even more challenging with the differing vehicles operators use to bring the equipment to the field. Geoprobe® has designed three options, providing different levels of features to make this easier for field operators.
The Vertical Instrument Rack is designed as permanent storage option for your instruments inside a van or truck unit. This rack makes use of often unused vertical space and conserving limited countertop space. Fasten the rack to the floor and walls for a stable and secure home for your instruments. The shelves slide out for easy access to connection on the rear of the instruments and also allow the operator to easily tighten the securing straps or get inside the instrument if needed.
Benchtop Instrument Carrier is another option to secure your instruments together. There are mounting holes and hardware for secure the MIP-GC and breakout panel to the top. Front and rear panels allow for the enclosure of all instruments inside the box for transport or shipping (not including the GC) without undoing any of the cable connections. This option also makes it very easy to move from a vehicle setup to a smaller platform (mobile cart) when performing space limited inside work without needing to disconnect instruments from one another.
Figure 9:
Vertical and Benchtop Instrument Racks
The ATV Instrument Carrier is designed as an all-terrain DI setup. This carrier also allows for the complete secured closure of the instruments with the additional wall panels with air flow between instruments. The instrument rack can be positioned in three of the four corners of the box for your customized layout and it includes a 30-gallon water tank, a lower horizontal gas bottle rack for your MIP carrier gases, dual 6-port powers strips wired directly to electrical plugs next to the bottle racks, and forklift pockets to get it easily on and off your ATV unit. This unit can also be freight shipped with to a job site leaving the instruments in place making for a quick start to a project.
Figure 10:
ATV Instrument Rack (side view)
Figure 11:
ATV Instrument Rack (rear view)
- Is the MIP a continuous sampling tool?
Yes. In standard MIP operation, the carrier gas stream continuously sweeps past the membrane and is transferred as a continuous stream to detectors at the surface. This occurs over the entire log depth not just when stopped at a specific interval, however it is at the stopped intervals that the probe/membrane is allowed to heat up and a “better” sample is collected.
- Does MIP work in the saturated and unsaturated zone?
Yes. Only the vapors will diffuse through the semi-permeable membrane which keeps waters out. VOC response will be seen both above and below the water table.
- Do soil types and or soil water content influence the systems detection limits?
Yes. Both can have an impact on the systems detection limits. Saturated soils tend to yield a slightly lower detection limit. Finer grained soils also tend to yield lower detection limits than coarser soils.
- What is the detection limit of the MIP?
- Hydrocarbons (BTEX)
- 0.20-2.0ppm with a PID
- Chlorinated solvents (TCE, PCE)
- 0.20-2.0ppm with an XSD-PID
- The low-level MIP method can produce detection limits 10x lower than standard MIP.
- Hydrocarbons (BTEX)
- What are the limiting factors for the Detection Limit?
- Detectors being used
- Detector maintenance level
- Membrane wear
- Pressure within the trunkline – based upon TL length and flow rate
- Rate of penetration into the subsurface
- Target compound boiling point Soil types
- Can the MIP be used for plume delineation?
Yes. The MIP is intended to be used to delineate volatile contaminant plumes. The MIP is designed as a mapping tool to locate source areas and for plume delineation down to 0.5ppm or more depending on the limiting factors of detection limits and if a specific low level MIP controller is being used.
- Can the MIP be used in the source area?
Yes. If you have a light petroleum VOC source such as gasoline or a chlorinated solvent such as PCE or lighter then MIP should work well to map out these source areas. When beginning work on a known source area operating a heated trunkline may help reduce the “carryover profile”. MIP logs will have an increased carryover profile when mapping sources areas of any heavier hydrocarbons such as diesel, jet fuels and motor oil due to their larger quantities of heavier molecules.
- Why and when would I choose to operate the MIP heated trunkline?
The use of this trunkline will keep the contaminants mobile in the trunkline which will produce better defined logs of the contaminants as well as keeps downtime between logs to a minimum. The heated trunkline should be used when you are expecting to operate in areas of high concentrations of gasoline or BTEX components including NAPLs of these compounds. High concentrations or DNAPLs of chlorinated solvents such as PCE or TCE would also benefit from the use of the heated trunkline. The heated trunkline will not help in the mapping of any heavier hydrocarbons such as diesel, jet fuels and motor oil instead it will increase their carryover profile. With these compounds the elevated temperature of the trunkline will slowly mobilize larger carbon chain molecules up to the detectors which will result in a very slurred log of contaminants. These larger carbon chain molecules would normally get cold trapped in the probe and early sections of the trunkline. The heated trunkline does not have HPT functions within the trunkline.
- Why is there carryover in my MIP logs?
The carryover profile in MIP logs is typically not the result of actually dragging contaminants down into the formation. When a MIP log is run through high concentration VOC zones it is common to see residual responses that taper off for the next 5-10ft. A portion of the diffusing contaminants will adsorb onto the membrane material which takes time to clear off which is accelerated with the probe heat cycling. The higher the boiling point of these compounds the longer it will take to desorb off of the membrane. Contaminants may also load up in the trunkline and take time to flush out. Another reason for the carryover profile is the presence of multiple compounds. In weathered gasoline and diesel there are large numbers of higher boiling point molecules which takes them longer to desorb off of the membrane as well as taking a longer time to travel through the trunkline resulting in much long trip times compared to the compound used to generate the logs trip time. All of this results in the software assigning their response to a depth perhaps well below the depth they originally encountered the membrane and carrier gas stream.
- How do contaminants move across the membrane?
Contaminants will cross the membrane by diffusion. The membrane is heated to encourage the contaminants to volatilize so they will more easily diffuse across the membrane. The concentration gradient in front of and behind the membrane also influences contaminant migration across the membrane.
- What detectors can be used with the MIP system?
Any lab grade gas phase detectors can be used.
- Standard Detectors: PID, FID, XSD
- Others include: ECD, DELCD, GCMS
- Can I determine contaminant concentration from my MIP logs?
No. Contaminant concentration cannot be directly determined from the MIP detector responses. The detectors are not able to be calibrated due to the changing subsurface conditions and influences that are encountered which cannot be reproduced at the surface resulting responses that are semi-quantitative. Variables that will influence detector response include soil type, water content, membrane wear, chemicals present and if there are mixes of different chemicals. The purpose of the chemical response test is to determine that the detector system is working consistently throughout the project.
- How can I best get a concentration value that corresponds to our MIP responses?
The best way to do this is to run a series of MIP logs and then begin to perform discrete confirmation sampling next to the log locations. Soil and/or water samples can be taken, where applicable, and analyzed either by fixed or mobile laboratories to determine specific contaminants and their concentrations. These results can then be plotted against the neighboring MIP responses to determine the relationship of concentration versus MIP response.
- How is MIHPT to be advanced into the subsurface?
When starting an MIHPT log the MIP membrane should be even with the ground surface, this is the zero point. Standard MIP advancement is done by advancing the probe in one-foot increments at a 2cm/sec rate between stopping points. When the probe is stopped at a sampling interval the operator is to wait for 45seconds for the MIP membrane block to heat up and for a consistent sample collection. Then the probe is advanced in ~15 seconds to the next sampling interval. The membrane is exposed for 45sec. in the response test and approximately the length of time it takes to add a rod. Stopping at each interval for 45seconds keeps the advancement and membrane exposure consistent. If the membrane exposure time is altered, it needs to be uniform across the site and in the response test to be able to compare the site data.
- Is there an ASTM standard for MIP?
Yes – ASTM D7352-18
- How do I view the data files?
All of the raw files generated by the MIP system can be opened with the DI Viewer. This is a free download off of our website.
- What is the testing procedure for the MIHPT system?
There are 3 different main sensors being operated on the MIHPT system and each one has a QA test that needs to be run to ensure the system is capable to generating good data.
- MIP – Chemical response test – the membrane is exposed to a solution containing a known chemical at a known concentration(s).
- EC – EC Dipole test – a low and high-level test load is applied between the dipole and body of the probe to check the EC system.
- HPT – HPT Reference test – evaluates the HPT sensors capability to accurately measure a column of water. This test also can ensure that there is no debris behind the HPT screen.
Tooling & Instrumentation
Geoprobe Systems® manufactures all of the equipment needed for MIP logging. This equipment can be divided into two basic categories: surface instrumentation (MIP controller, data acquisition, and detectors), and downhole probes (including probes, trunklines, connectors, etc.).
The typical instruments used for MIP logging include the following:
- FI6000: Data acquisition instrument, acquires data from the MIP system’s detectors and sensors and relays it to the computer via a USB connection. The FI6000 is the general data acquisition instrument used in all Geoprobe® DI logging systems (EC and HPT). It also provides the electrical conductivity measurement system associated with MIP.
- K6300 Series HPT Controller: The instrument pumps, controls and monitors water flow and pressure through the water line and HPT injection port on the MIHPT probe. (This controller is optional for MIP logging).
- MP6500 Series MIP Controller: This instrument regulates and measures gas pressure and flow to the MIP probe and controls heating of the probe. Data from this controller is sent to the FI6000 via a data cable.
- GC1000: This is the platform of detectors used in the MIP System. Standard detectors offered in this system include the PID, FID, and XSD. Analog data outputs from this instrument are directed to the FI6000.
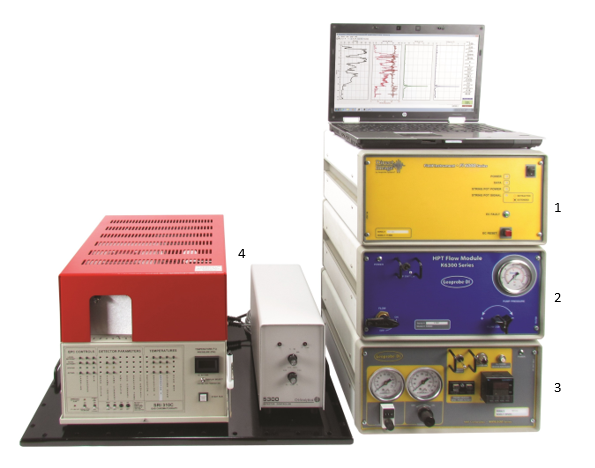
Figure 12:
MIHPT Instrumentation
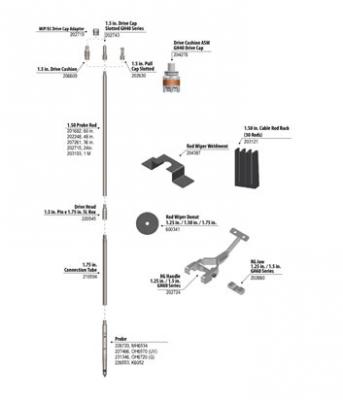
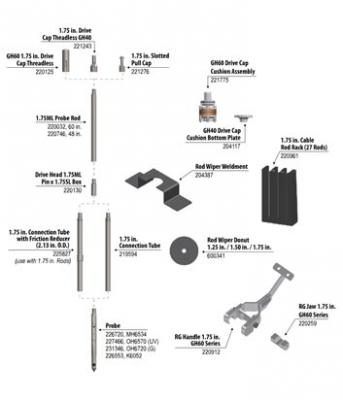
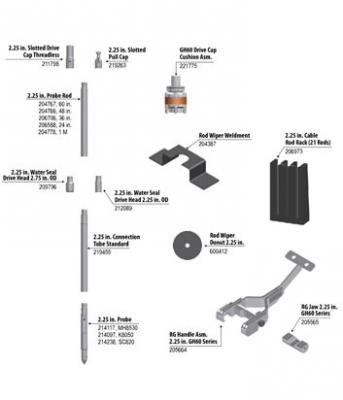
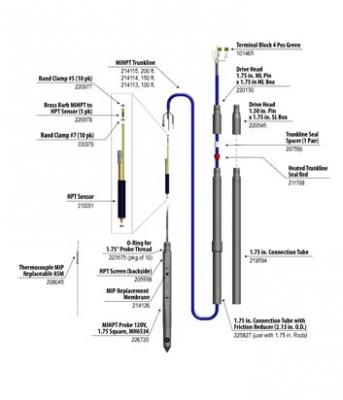
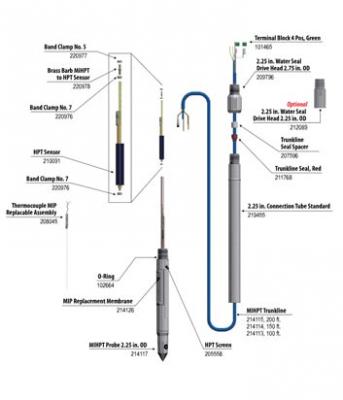
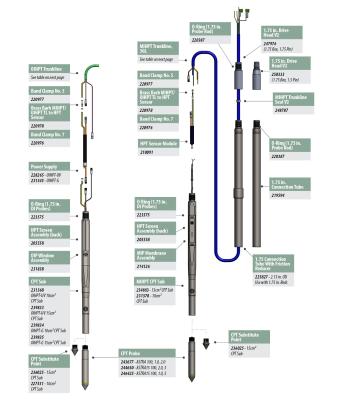
The most commonly deployed components are shown below. There are many variations and combinations of this tooling, depending on the size of the rod string being driven into the ground and the lithology or permeability sensors that are to be used in combination with the MIP. These components include:
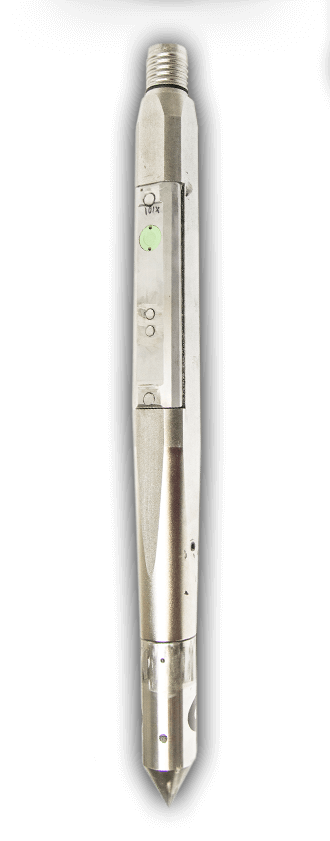
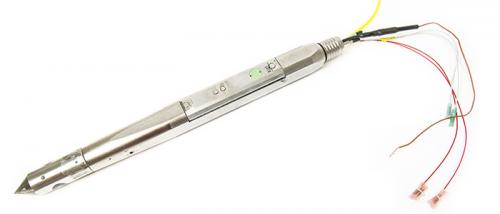
- MH6534 MIHPT probe (MN 226720): 120 VAC heated probe with removable membrane, HPT screen and dipole electrical conductivity array.
- MIHPT trunkline (MN 236310)/MIP Trunkline (MN 202570): 150 ft. (46m) with PEEK return line.
- HPT pressure sensor (MN 210091) (used when collecting HPT pressure data - not required for MIP data collection).
- Connection section and drive head. Gas line, electrical connections and HPT sensor are carried in this section.
- Probe rods. Geoprobe® 1.75-inch (44mm) and 1.5-inch (38mm) rods are the most commonly used for MIP logging. Successive sections of these rods are added to push or percussion drive the probe to depth.
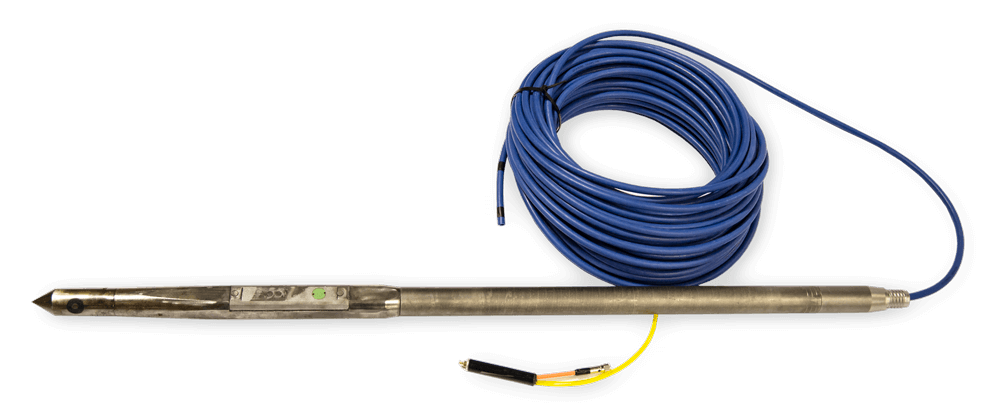
Figure 13:
MIHPT probe, HPT sensor (run inside connection tube), connection tube and drivehead which connects to the drive rods. The MIHPT trunkline connects the down-hole probe to the up-hole instruments.
Having HPT data along with the MIP-EC data provides the site investigator a powerful combination of logging tools. This tool provides the ability to estimate soil permeability with the HPT at the same time detect volatile compounds with the MIP and measure soil/pore fluid conductance with EC. The MIHPT probe and system can be operated with all sensors collecting data or it can be used to collect just HPT-EC data or just MIP-EC data depending upon project and weather considerations.
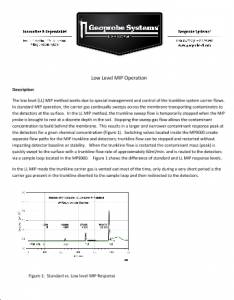
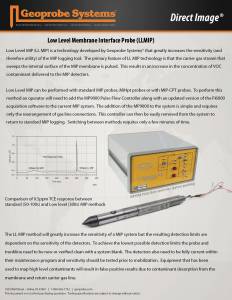
Low Level MIP (LL MIP) is a technology developed by Geoprobe Systems® that greatly increases the sensitivity (and therefore utility) of the MIP logging tools. The primary feature of LL MIP technology is that the carrier gas stream that sweeps the internal surface of the MIP membrane is pulsed. Management of the gas stream pulsing is handled by the Pulse Flow Controller and software. This results in a more concentrated slug of VOC contaminant delivered to the MIP detectors. This controller and method can be successfully employed into any MIP probe and trunkline and most detector configurations.
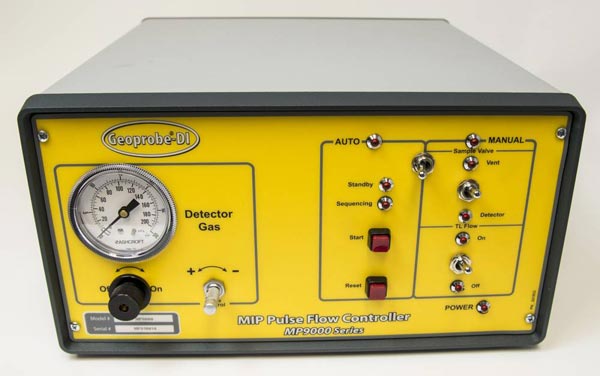
Figure 14:
Low Level MIP Pulse Flow Controller
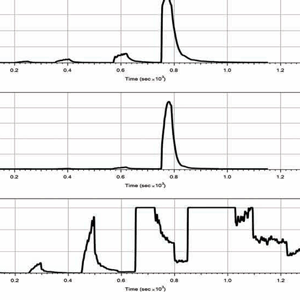
The improvement in detection response when using the LL MIP pulse flow controller is typically around a ten fold increase. The improved response will therefore reduce that systems detection limit by that same amount compared to what it could detect in standard MIP operation. The response test displays an example difference the change in method makes in MIP-XSD response magnitude. This method allows for the possiblity to delineate VOC plumes to well <100ppb depending upon the condition of the equipment the pulse flow controller is paired with.
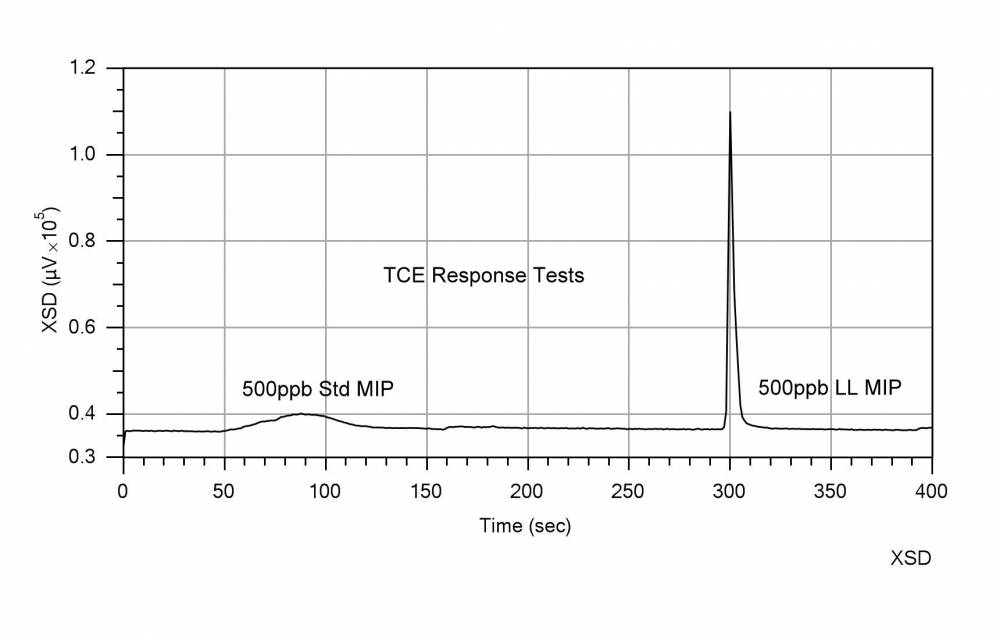
Figure 15:
MIP response test comparison using TCE at 500ppb: Standard vs. LL MIP
The heated trunkline is an optional addition to MIP logging which provides a heated transport of carrier gas from probe to detectors within this trunkline. The heated trunkline is typically operated at 100oC which provides an environment of accelerated contaminant transport reducing the possibility of contaminant cold trapping within trunkline gas lines as can occur with an ambient temperature trunkline. The heated transport environment can result in improved resolution of the bottom of the plume compared to unheated trunkline when operated in gasoline and CVOC plumes. The heated trunkline system also reduces the chance of water vapor condensing in the gas lines during cold weather logging.
The heated TL is available only in MIP-EC and does not have HPT capability within the smaller 1.75" tooling.
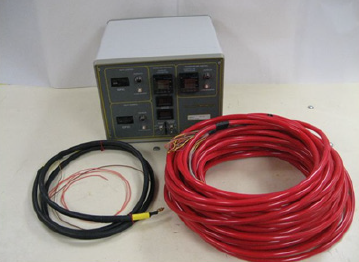
Figure 16:
Heated trunkline Components: Heated Trunkline, Transfer line and Controller
The heated trunkline system is made up of the HTL controller, trunkline and transfer line. The heated trunkline controller monitors and regulates the temperature of the trunkline and the transfer line through heater and thermocouple wires. All other probe sensors are controlled by the MIP controller and field instrument.
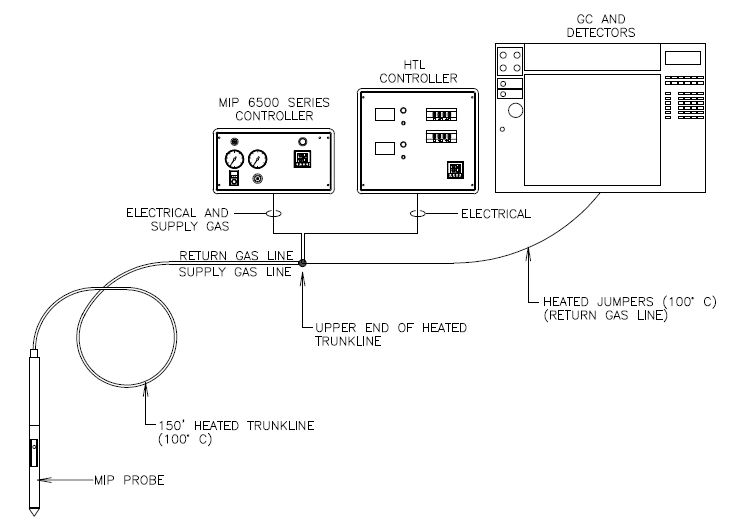
Figure 17:
MIP Heated Trunkline Setup Schematic
MIHPT CPT sub MN231370 operates using a 10cm2 cone or MN234883 operates using a 15cm2 cone. These configurations combine HPT, EC and CPT soil characteristic measurements with the MIP VOC contaminant mapping. This tool combination features easy connection of the CPT cone. CPT static push only deployment of MIHPT typically yields much longer life for the MIHPT probe compared to percussion driven models.
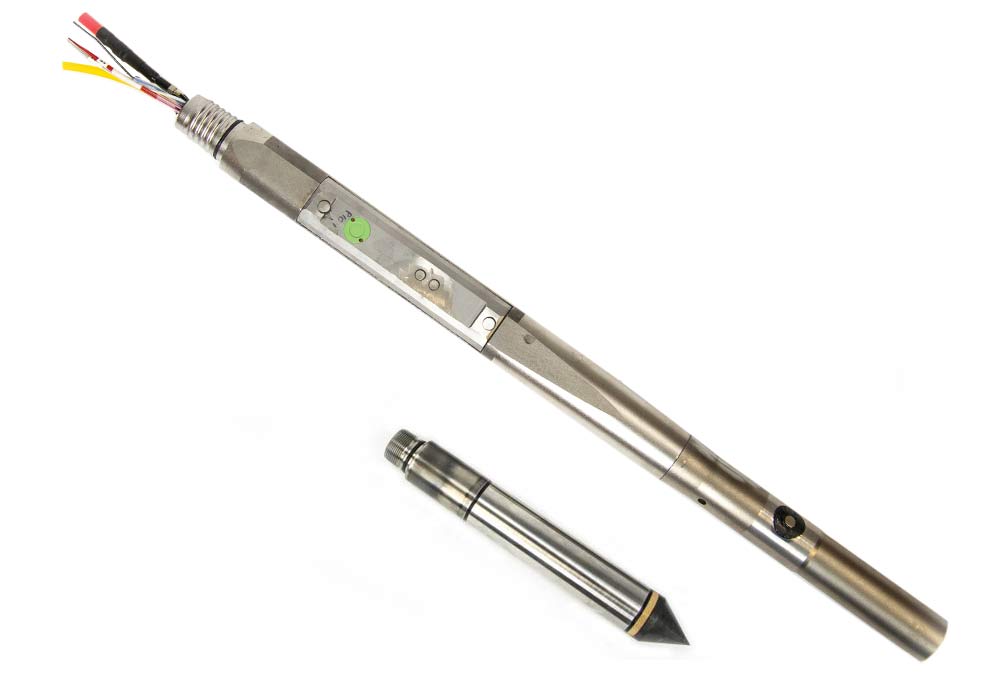
Figure 18:
MIP-CPT Sub: Combines a MIP sub with either a 10cm2 or 15cm2 cone
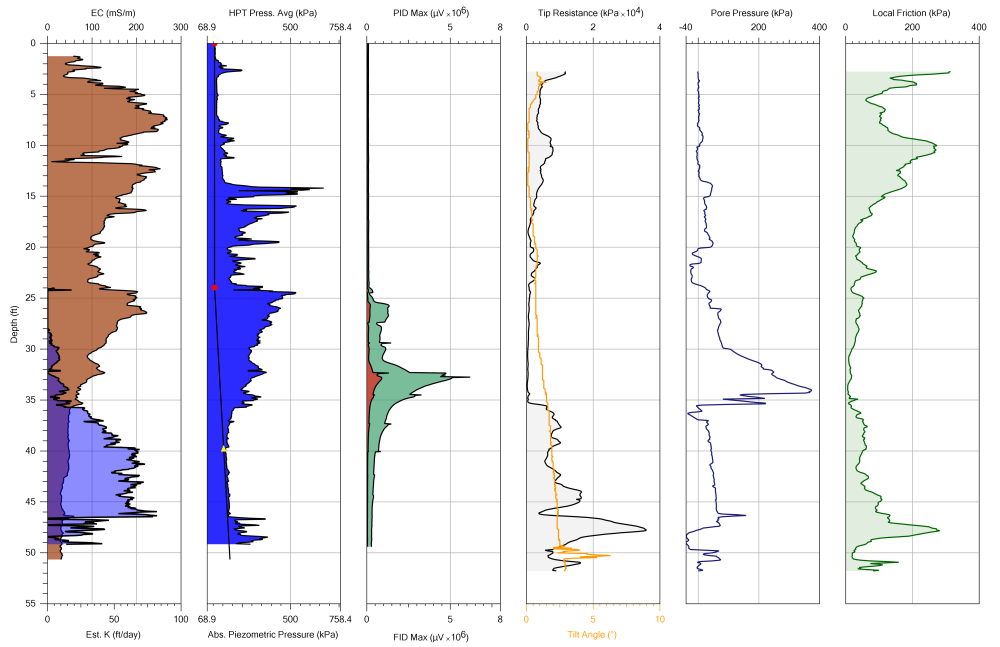
Figure 19:
Combined MIP-CPT Log
Videos
ID: 1977
ID: 1982
ID: 1892
ID: 1995
ID: 1979
ID: 1980
Resources
Click on a section below to view information.


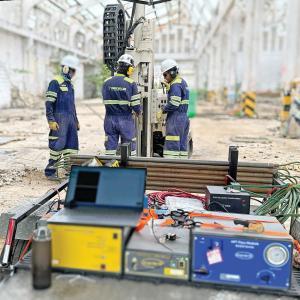
Equipment used and overall operation layout during a MIHPT location.
ID: 14618 | Date:
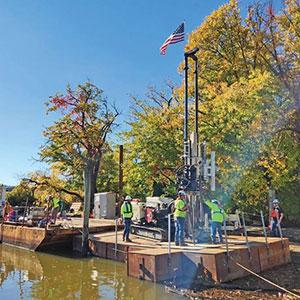
Landing a barge project, ODYSSEY ENVIRONMENTAL SERVICES Owner and Project Manager Jason Miller knew he needed to run tooling beyond the capabilities of his fleet of three 7822DTs. The predominantly environmental and geotechnical drilling company in Pennsy
ID: 13405 | Date:
LL MIHPT site characterization report provides valuable data to ensure permeable reactive barrier contains entire contamination plume at reduced cost to initially proposed plan.
ID: 12403 | Date:

Leaning on the can-do lessons of his Marine training and the small-company culture he cherished during his first drilling job guides building Veteran Drilling into high resolution site characterization resource for California.
ID: 5775 | Date:
Most MIP (Membrane Interface Probe) work is performed to map...
ID: 5220 | Date:


| Power Rating Chart For the MIP system | Power (Watts) |
|---|---|
| K6300 | 250 |
| FI6000 | 200 |
| MP6505 | 850 |
| MP7000 | 2,400 |
| MP9000 | 150 |
| GC with Detectors | 2,070 |
| Stand Alone FID Air Compressor | 550 |
*-Size generator for at least 30% over total power of system also considering other components powered by the generator, i.e. heater, air conditioner.
| Flow and Pressure | 100ft | 150ft |
|---|---|---|
| Primary Gauge | 20psi (138kPa) | 20psi (138kPa) |
| Mass Flow Controller | ||
| Peek Trunkline | 10psi (69kPa) | 10psi (69kPa) |
| Mass Flow Controller | ||
| Heated Trunkline | 7psi (48kPa) | 7psi (48kPa) |
| MIP TL Supply Flow | 20-60ml/min | |
| MIP TL Return Flow | within 3ml/min of supply | |
| Dryer Flow in ml/min | 2x Probe Flow | 2x Probe Flow |
| Testing the MIP System | Volts | Ohms | Testing Position |
|---|---|---|---|
| Heater Probe & Trunkline | 120 | <25 | Back of MIP box/Breakout panel – 2 heater wires |
| Electrical Conductivity | 0.75 | O.L. | Dipole and body of MIP probe |
| Line Voltage | 120 | Generator or Land Line | |
| Thermocouple | <300ohms | Breakout panel – 2 TC wires |
Depend on Team Geoprobe®
Since 1987, Geoprobe® has manufactured innovative drilling rigs and tooling - engineered for efficiency and safety - simplifying drillers’ jobs and empowering their companies to succeed as productive and profitable leaders in the industry. When you partner with Geoprobe® you receive:
Customer-inspired Innovation
Engineering and building industry-leading drilling rigs, tooling, and techniques for the technical driller based on your needs to work safer and more efficiently.
Exceptional Value
Ensuring drilling rigs and tooling are created in conjunction – with consistent quality – to collect the highest-quality information with the most accurate result to get you to, into, and through the job efficiently.
Superior Service
Equipping you to do your best job and keeping you in the field via one-on-one expert sales and service technicians manning live support phone lines, shipping necessary parts same-day.
What is Geoprobe® Direct Image® MIP?
- Logs VOC contaminants and soil electrical conductivity (EC) and permeability (HPT) with depth.
- Shows distribution and relative magnitude of both halogenated and non-halogenated VOC contaminants.
- Works in both saturated and unsaturated soils.
- Detects contaminants in both coarse and fine-grained soils.
- Only tool capable of logging dissolved phase VOCs in situ in real time.
- Determine contaminant mobility and migration pathways with EC and HPT.
- Used worldwide for environmental site characterization of subsurface VOC contaminants.
- Standard tool configurations combine the MIP with other sensors for lithology and permeability logging.
- Real time contaminant screening information is generated, allowing field adjustment of the site investigation.
The MIP was developed by Geoprobe Systems® and is presently manufactured and sold exclusively by Geoprobe Systems® and its distribution agents. The MIP has been used extensively in the U.S. and Europe for mapping the extent of VOC contamination in the subsurface. As a logging tool, the MIP offers many benefits to site investigators as listed above.
The MIP (membrane interface probe) is a direct push tool used to log the relative concentration of volatile organic compounds (VOCs) with depth in soil. An example log made using an MIP System is shown below.
Figure 1: A typical MIP log from a former gas station site: Graphs (left to right) Soil Electrical Conductivity, HPT Pressure with Absolute Piezometric Pressure and Static Water Level, Photoionization Detector, Flame Ionization Detector and Halogen Specific Detector
:
:
:
The Membrane Interface Probe (MIP) is a screening tool with semiquantitative capabilities acting as an interface between volatile contaminates at depth in the soil and gas phase detectors at the surface. The MIP membrane is semipermeable and is comprised of a thin film polymer impregnated into a stainless steel screen for support. The membrane is approximately 6.35mm in diameter and can be easily replaced. The membrane is placed in a heated block attached to the probe. This block is heated to approximately 100-120 degrees C as the probe is advanced into the soil. Heating the block accelerates anlayte diffusion across the membrane while at the same time minimizing membrane absorption. Diffusion across the membrane is driven by the concentration gradient between the contaminated soil and the clean carrier gas behind the membrane. A constant gas flow of 35-45 mL/min sweeps behind the membrane and carries the contaminants to the gas phase detectors at the surface. Travel time from the membrane interface to the detector(s) is approximately 30-60sec (depending on the length of trunkline and flow rate).
Figure 2: Principles of Operation: The downhole, permeable membrane serves as an interface to a detector at the surface. Volatiles in the subsurface diffuse across the membrane and partition into a stream of carrier gas where they can be swept to the detector. The membrane is heated so that travel by VOCs across this thin film is almost instantaneous. MIP acquisition software logs detector signal with depth.
A typical MIP detector system utilizes three detectors: a PID (photoionization detector), FID (flame ionization detector) and an XSD (halogen specific detector). Each of these detectors respond to different traits of an analyte and the combination of all three provides the investigator with the ability to discern between typical contaminant types such as gasoline, chlorinated solvents and methane even when comingled. See the detector information tab for more specifics on detector operation and the example log tab to see how the detectors respond differently to varying contaminant family groups.
Figure 3: MIP detector system, typically with three installed detectors: PID, FID, XSD
:
:
In practice, an MIP detector log is seldom used apart from a simultaneous log indicating lithology. This accompanying log typically is electrical conductivity (EC) of soil but can include or be replaced by hydraulic profile (HPT) or CPT parameters. The next two figures show the true power of combining lithology sensors with the MIP detectors in one profile. Both logs below show an MIHPT Log displaying EC (electrical conductivity of soil), HPT injection pressure (top axis) with absolute piezometric pressure (bottom axis), PID, FID, and XSD detector graphs, along with estimated hydraulic conductivity.
Note: Refer to the Geoprobe® MIP SOP for specific settings and gas flows of the MIP-PID, FID and XSD detectors.
Figure 6: A typical MIHPT log includes (from left to right) an EC (electrical conductivity of soil) log, HPT injection pressure (top axis) with Absolute Piezometric Pressure (bottom axis), MIP-PID, FID, and XSD detector graphs. The MIP-PID and FID graphs indicate most of the contaminant mass is located at depths of 25 to 32 feet. The EC and HPT graphs indicate there is a transition from a fine to coarse grain soil unit (lower permeability) at this depth.
The soil EC graph in the following log is not as clear to the changes in lithology transitional zones sand/silt/clay as in the previous log. This is likely due to differences in soil mineralogy of the region the log was performed. When EC is paired with the HPT, which is a measurement of the soil physical properties of permeability, operators can have greater confidence of subsurface lithological changes and better understand what is occurring when EC and HPT pressure do not mirror each other. When the EC and HPT pressure graphs diverge it may indicate zones of cemented sands or brine contamination.
Figure 7: An MIHPT log includes (from left to right) an EC, HPT injection pressure (top axis) with Absolute Piezometric Pressure (bottom axis), MIP-PID, FID and XSD detector graphs and estimated hydraulic conductivity (K). The MIP detectors indicates the majority of contaminant mass is positioned in a low permeable zone (note HPT higher pressure) at a depth of 13 to 16 feet. This log was obtained on a TCE contaminated site which is confirmed by the similar responses on the PID and XSD.
In practice, multiple MIP logs are used on a site to determine the location of a contaminant source area, to track the movement of a contaminant plume, to define the contaminant mass for remediation, or to investigate the efficiency of a remediation treatment. Whatever the purpose of the MIP logging, multiple logs are always be performed at any one site.
The MIP log shows the response of the MIP detectors with depth in the soil. The MIP data acquisition system makes this log by considering the travel time required for the membrane sweep gas to reach the MIP detectors at ground surface, thus converting the detector time data into MIP response with depth data. An example series of MIP logs from a contaminated site are shown in the following displayed log. The logs in this series, or cross section, show the response of the PID detector in the MIP system with depth. The contaminant at this site is a fuel hydrocarbon from a former gas station. This figure shows the main utility of MIP logs in that the position of the contaminant, which varies from location to location, is described by the MIP log. The concentration of the contaminant also varies across the site, which is described by the wide range of responses shown on the MIP logs in the cross section view.
Figure 8: A cross section of site MIP logs from a former gas station location. The graphs shown above are MIP-PID (photo ionization detector) graph shaded in blue along with EC (dashed black line). These logs illustrate the use of MIP in defining the depth at which contaminants are encountered. The concentration represented in each of these logs is also vastly different with all logs being set to the scale 3x10e7. These logs were performed approximately 16m apart on the same site.
DI Viewer is a free program, downloadable from the link below, which allows the user to display any of the Direct Image® log types (MIP, OIP, HPT, EC). With this program the user can display the raw data .zip files of each saved graph of an individual log in single log view or compare them to other logs using the overlay and cross sectional view functions. Log specific QA data is also accessible with this software which also allows one to print or export the logs data for 3D modeling or into .jpg or .png files.
:
Having a quality method of carrying the Direct Image® instruments with an orderly layout is not always easy and can be made even more challenging with the differing vehicles operators use to bring the equipment to the field. Geoprobe® has designed three options, providing different levels of features to make this easier for field operators.
The Vertical Instrument Rack is designed as permanent storage option for your instruments inside a van or truck unit. This rack makes use of often unused vertical space and conserving limited countertop space. Fasten the rack to the floor and walls for a stable and secure home for your instruments. The shelves slide out for easy access to connection on the rear of the instruments and also allow the operator to easily tighten the securing straps or get inside the instrument if needed.
Benchtop Instrument Carrier is another option to secure your instruments together. There are mounting holes and hardware for secure the MIP-GC and breakout panel to the top. Front and rear panels allow for the enclosure of all instruments inside the box for transport or shipping (not including the GC) without undoing any of the cable connections. This option also makes it very easy to move from a vehicle setup to a smaller platform (mobile cart) when performing space limited inside work without needing to disconnect instruments from one another.
Figure 9: Vertical and Benchtop Instrument Racks
The ATV Instrument Carrier is designed as an all-terrain DI setup. This carrier also allows for the complete secured closure of the instruments with the additional wall panels with air flow between instruments. The instrument rack can be positioned in three of the four corners of the box for your customized layout and it includes a 30-gallon water tank, a lower horizontal gas bottle rack for your MIP carrier gases, dual 6-port powers strips wired directly to electrical plugs next to the bottle racks, and forklift pockets to get it easily on and off your ATV unit. This unit can also be freight shipped with to a job site leaving the instruments in place making for a quick start to a project.
Figure 10: ATV Instrument Rack (side view)
Figure 11: ATV Instrument Rack (rear view)
:
Laboratory grade, gas phase detectors are needed for the detection of volatile organic contaminants in the carrier gas stream. The gas phase detectors are typically mounted on a gas chromatograph (GC). The standard detector setup uses a PID, FID and XSD detector, however, different models of GCs and detectors can be used with a MIP system. The use of multiple detectors is helpful for determining compound class but not individual volatile compounds. Certain detectors may be operated in series for the detection of different contaminant types. A brief discussion of commonly used detectors with the MIP system is provided below.
Figure 4: Common Gas Chromatograph with Gas Phase Detectors used in MIP Operations
When the carrier gas from the probe returns to the surface and enters the detector system, it first passes through a nafion dryer to remove potential moisture from the carrier gas stream and then flows into the photoionization detector (PID) which is a non-destructive detector. From the PID the carrier gas returns to the GC oven and is split between the flame ionization detector (FID) and the halogen specific detector (XSD) which are both destructive detectors. Analyte response is seen as a current response within each detector.
Figure 5: Common Gas Phase Detectors: (A) XSD, (B) FID, (C) PID
:
: