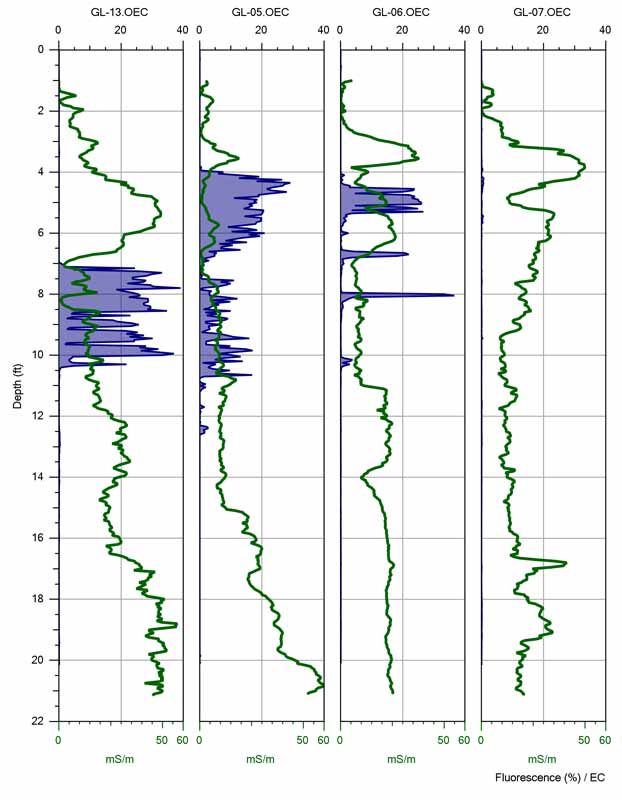
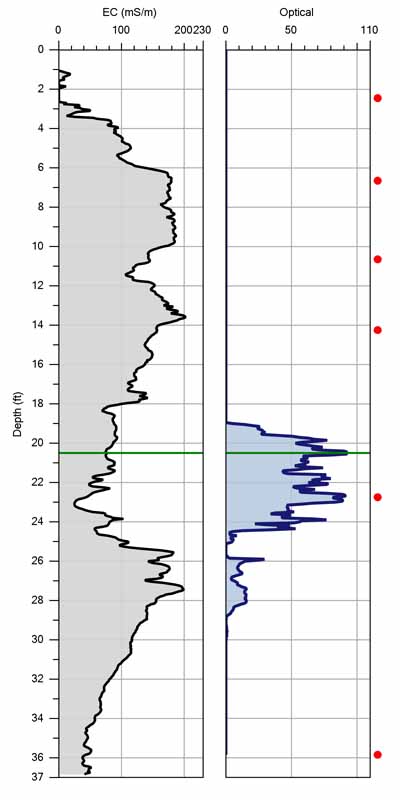
OIP log cross-section from former gas station site. Electrical Condtivity (EC) logs are shown in green. The OIP fluorescence are (%) is shown by the blue shaded area. Cross sections of OIP logs are easily developed using the DI Viewer Software available from Geoprobe Systems®.
The Direct Image® Team at Geoprobe Systems® proudly announces the release of their newest Direct Image® logging tool ... the Optical Image Profiler (OIP). The easy-to-use OIP is capable of capturing soil images using both visible and UV light sources. The logs can then be used to create highly detailed conceptual site models.
The Optical Image Profiler (OIP) is a direct push probe that uses UV fluorescence to locate hydrocarbon contamination as the probe is pushed or driven into soil. This new system uses camera imaging of the soil in the presence of UV light to identify and log non-aqueous phase (NAPL) hydrocarbons in soil. The probe can be percussion driven through unconsolidated formations using the extensive line of Geoprobe® direct push machines.
The OIP probe is switchable between visible and fluorescent light images and is equipped with an electrical conductance array for logging soil lithology. The OIP has been used to determine the extent of contamination from leaking underground storage tanks and pipeline spill sites with gasoline, diesel fuel, and crude oil hydrocarbons. The probe is capable of logging to depths greater than 80 feet (24m).
“The OIP logging tool continues the Geoprobe® history of innovation,” says Tom Christy, Vice President, Geoprobe® DI Group Team Leader. “Imagine a probe you can drive into the ground and see images of fuel fluorescence, and then flip to visible mode and see the soil.” The OIP systems makes that concept a reality.
“The fact that we could see hydrocarbon fluorescence in real time was very compelling,” Tom added. “Sure, we can analyze those images to give a detection factor and make a log of that. But you can see it with your ‘own eyes in the ground’. And you can save all those images and review them to QC the log. It’s hard to argue with actual soil images.”
The OIP shares many compatible tool string and data acquisition components with the company’s popular MIP and HPT tools. A patent is pending for this device. More information, plus a video, is available at geoprobe.com/oip-optical-image-profiler
Contact Us
1835 Wall Street
Salina, Kansas 67401
Phone: (785) 825-1842
Photo Gallery
OIP log cross-section from former gas station site. Electrical Condtivity (EC) logs are shown in green. The OIP fluorescence are (%) is shown by the blue shaded area. Cross sections of OIP logs are easily developed using the DI Viewer Software available from Geoprobe Systems®.
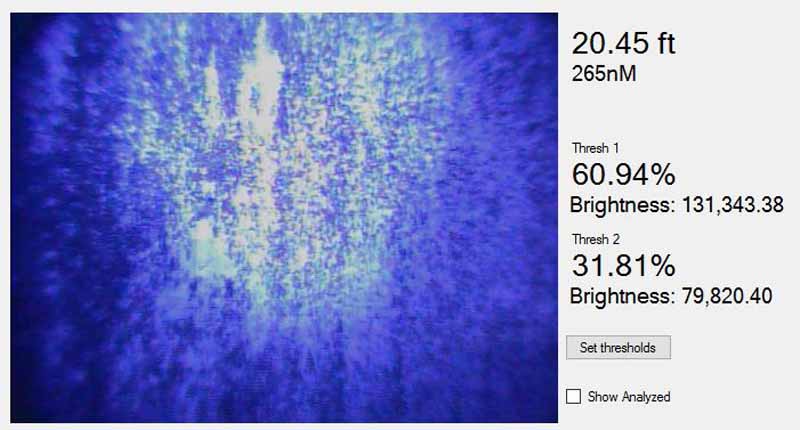
A UV fluorescence image from 20.45 feet (6.23 m) depth on the log. Image analysis indicates that over 90 percent of this image exhibits fuel fluorescence.
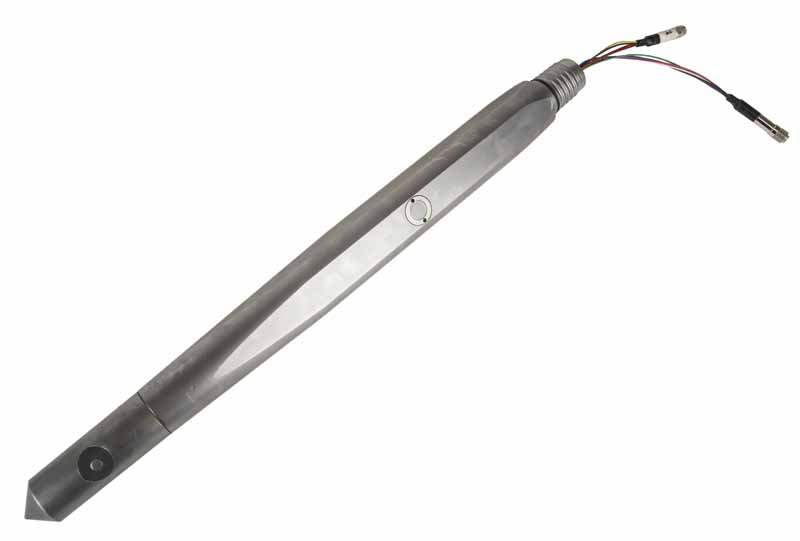
Optical Interface Probe (OP6560)
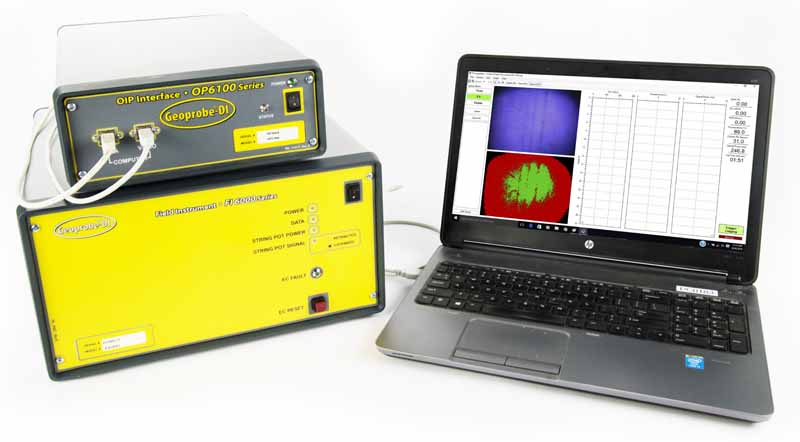
OIP System Major Components: (top, clockwise) Optical Interface (OP6100), Laptop Computer, Field Instrument (FI6000).
Typical OIP log. The soil Electrical Conductivity is shown on the left. The OIP log of Fluorescence (% of Image Area) is shown on the right. In this case, the OIP log indicates the presence of NAPL from approximately 19 to 29 ft. (5.7 to 8.8 m).
Related Videos
ID: 6608
ID: 1997
ID: 1996
ID: 1994
ID: 1995
ID: 1979
ID: 1965
ID: 279